How to Calculate Mean Absolute Deviation Step by Step
A beginner-friendly walkthrough of mean absolute deviation — what it measures, the exact formula, and two fully worked examples you can follow by hand or check instantly with a free calculator.
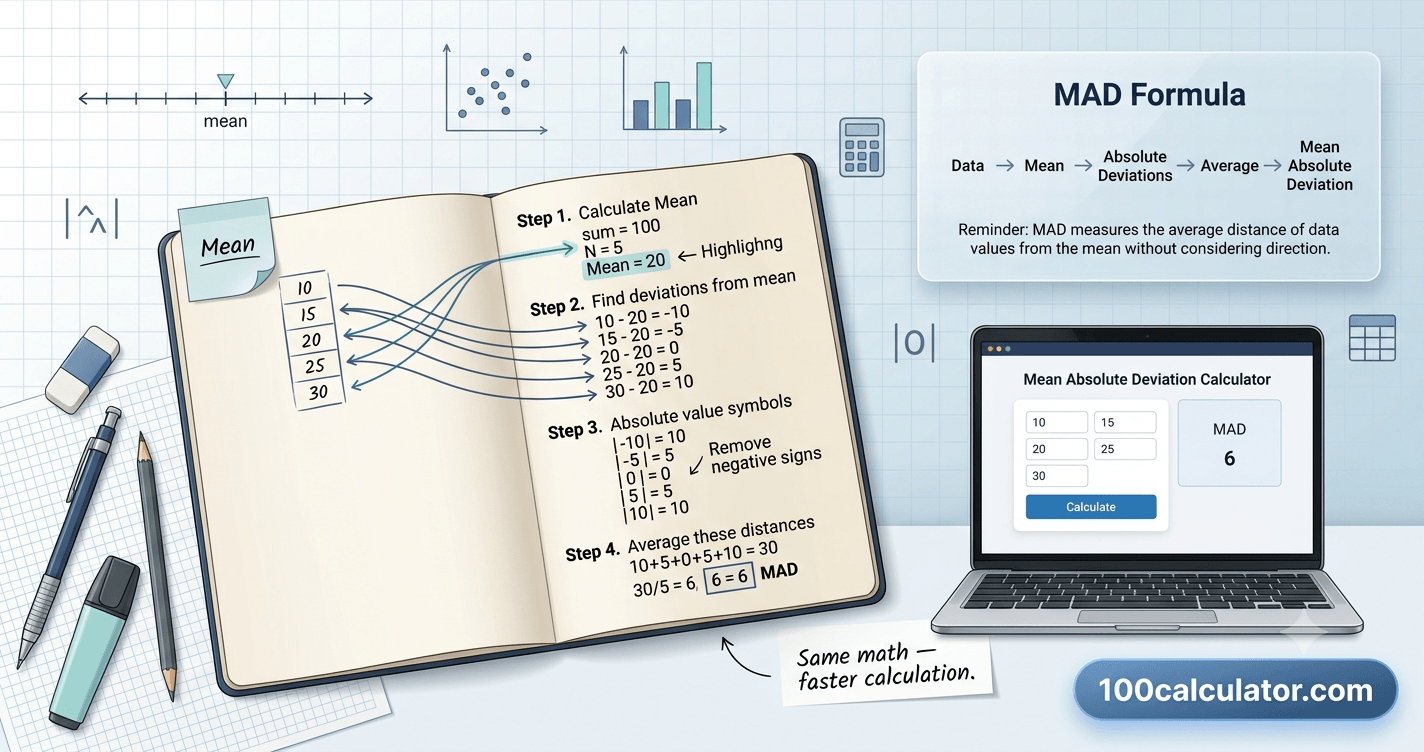
If you've ever looked at a list of numbers and wondered how "spread out" they really are, mean absolute deviation is one of the simplest ways to find out. It's a measure of variability that tells you, on average, how far each value in a data set sits from the mean — and unlike some statistics, you can calculate it by hand in just a few steps.
Mean absolute deviation (MAD) is the average distance between each value in a data set and the mean of that data set, found by taking the absolute value of each deviation so positive and negative differences don't cancel each other out. A small MAD means your data points cluster tightly around the average. A large MAD means they're more spread out. Teachers use it to compare how consistent test scores are, businesses use it to track how steady sales numbers are, and statistics students often meet it before standard deviation because it's easier to calculate by hand.
This guide walks through exactly how to calculate mean absolute deviation step by step, with the formula explained in plain language and two fully worked examples you can follow along with. If you'd rather skip the manual math, 100 Calculator's Mean Absolute Deviation Calculator does the same calculation instantly — but working through the steps first will help you use it, and trust its results, with more confidence. Let's start with exactly what mean absolute deviation measures.
What Is Mean Absolute Deviation?
Mean absolute deviation measures how far, on average, each number in a data set sits from the mean of that data set. Statisticians call this kind of measurement a measure of dispersion, or a measure of variability, because it describes how spread out your numbers are rather than where they're centered.
Think of it this way: if you know a class's average test score is 82, that number alone doesn't tell you much about individual performance. Did everyone score close to 82, or did scores range wildly from 60 to 100? Mean absolute deviation answers exactly that question, in a single, easy-to-read number.
Key Terms to Know Before You Start
Before working through the formula, it helps to be comfortable with a few terms that come up throughout this guide:
- Data set: the full list of numbers you're analyzing, like a list of test scores or commute times
- Mean: the average of your data set, found by adding all the values and dividing by how many there are
- Deviation: the difference between one value and the mean
- Absolute value: a number's distance from zero, always expressed as positive, written between two vertical bars, like |−4| = 4
With those four terms in place, mean absolute deviation is really just describing one idea: take every value's distance from the mean, ignore whether that distance is positive or negative, and average those distances together.
Why Mean Absolute Deviation Matters
Averages are useful, but they can also hide important details. Two completely different data sets can share the exact same mean while looking nothing alike once you account for spread.
For example, imagine two groups of five students who each average a score of 24 out of 30. In the first group, every single student scored exactly 24. In the second group, scores were 20, 22, 24, 26, and 28 — still averaging 24, but clearly more varied. Both groups share an identical mean, yet the second group has real variation in performance, and mean absolute deviation is what puts a number on that difference.
Who Uses Mean Absolute Deviation?
Mean absolute deviation shows up most often in:
- Introductory statistics courses, where it's usually taught before standard deviation because it's easier to calculate by hand.
- Quality control and manufacturing, where consistency between measurements matters as much as the average measurement itself.
- Business reporting, where analysts want a simple way to describe how much sales, costs, or performance numbers vary from month to month.
- Everyday comparisons, like comparing the consistency of two students' quiz scores or two athletes' game-by-game performance.
The Mean Absolute Deviation Formula
Once you're comfortable with the key terms, the formula for mean absolute deviation is refreshingly simple. There's only one version of it, and it works the same way whether you have five data points or five hundred.
Mean Absolute Deviation Formula
MAD = Σ|x - x̄| / n
x — each individual value in the data set
x̄ — the mean (average) of the data set
| | — absolute value, which removes any negative sign
Σ — sum of all the absolute deviations
n — the total number of values in the data set
Written out in plain language, that formula says: subtract the mean from each value, take the absolute value of each result, add all of those together, and divide by however many values you started with. The next section walks through exactly how to apply that formula step by step.
Does Mean Absolute Deviation Use n or n − 1?
Unlike sample standard deviation, which sometimes divides by n − 1 to correct for bias in small samples, mean absolute deviation is almost always calculated by dividing by the total number of values, n, whether you're working with an entire population or a smaller sample. If a specific textbook or course asks for a different convention, follow those instructions — but the formula above is what you'll see in the vast majority of statistics classes.
How to Calculate Mean Absolute Deviation Step by Step
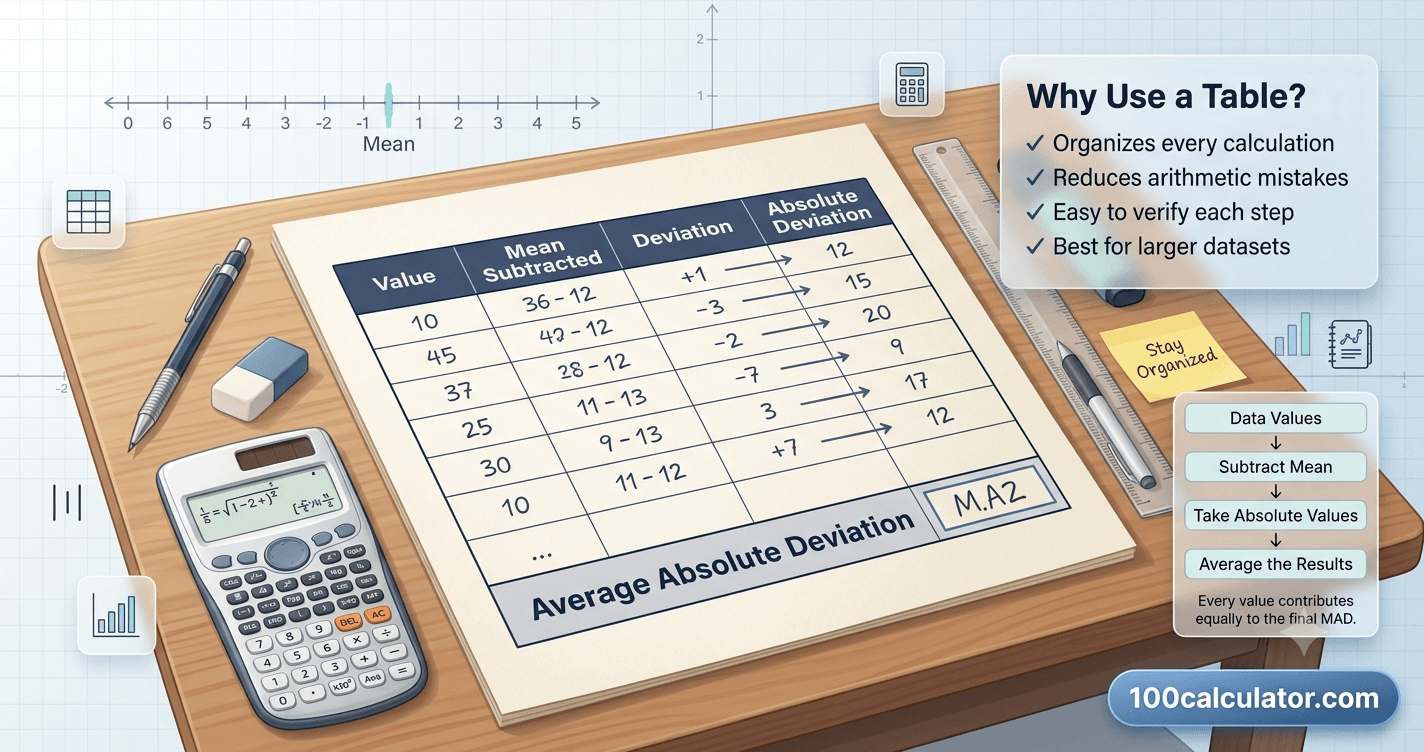
Here's the exact process to follow, broken into four steps you can apply to any data set.
- Find the mean of your data set. Add up every value, then divide by the total number of values. This gives you the baseline every other step compares against.
- Subtract the mean from each individual value. Do this one value at a time. Some results will be positive, for values above the mean, and some will be negative, for values below it — that's expected at this stage.
- Take the absolute value of each result. Drop the negative signs so every deviation becomes a positive number, or zero. This is what keeps values above and below the mean from canceling each other out.
- Add up all the absolute deviations, then divide by the number of values. The result is your mean absolute deviation — the average distance between each value and the mean.
Worked Examples of Mean Absolute Deviation
The clearest way to understand mean absolute deviation is to work through it with real numbers. Here are two examples: one where the numbers divide evenly, and one that requires rounding, since real data doesn't always cooperate.
Example 1: Commute Times for Five Employees
Suppose five employees track how many minutes their commute takes one morning: 22, 28, 24, 26, and 20 minutes. Here's how to find the mean absolute deviation of that data set.
Step 1: Find the mean.
(22 + 28 + 24 + 26 + 20) ÷ 5 = 120 ÷ 5 = 24 minutes
Steps 2 and 3: Find each deviation, then take the absolute value.
| Commute Time (min) | Deviation From Mean | Absolute Deviation |
|---|---|---|
| 22 | 22 − 24 = −2 | 2 |
| 28 | 28 − 24 = 4 | 4 |
| 24 | 24 − 24 = 0 | 0 |
| 26 | 26 − 24 = 2 | 2 |
| 20 | 20 − 24 = −4 | 4 |
Step 4: Add the absolute deviations and divide by
n.
(2 + 4 + 0 + 2 + 4) ÷ 5 = 12 ÷ 5 = 2.4
The mean absolute deviation is 2.4 minutes. On average, each employee's commute time differs from the group's average commute of 24 minutes by about two and a half minutes.
Example 2: Test Scores for Seven Students
Now try a data set where the final answer doesn't come out as a round number, which is common with real-world data. Seven students score 70, 75, 80, 85, 90, 95, and 100 on a quiz.
Step 1: Find the mean.
(70 + 75 + 80 + 85 + 90 + 95 + 100) ÷ 7 = 595 ÷ 7 = 85
| Score | Deviation From Mean | Absolute Deviation |
|---|---|---|
| 70 | 70 − 85 = −15 | 15 |
| 75 | 75 − 85 = −10 | 10 |
| 80 | 80 − 85 = −5 | 5 |
| 85 | 85 − 85 = 0 | 0 |
| 90 | 90 − 85 = 5 | 5 |
| 95 | 95 − 85 = 10 | 10 |
| 100 | 100 − 85 = 15 | 15 |
Step 4: Add and divide.
(15 + 10 + 5 + 0 + 5 + 10 + 15) ÷ 7 = 60 ÷ 7 ≈ 8.57
The mean absolute deviation here is about 8.57 points. Notice that this data set is more spread out than the first example — scores range a full 30 points from lowest to highest — and the larger MAD reflects exactly that.
Mean Absolute Deviation for Grouped Data
Sometimes data isn't listed value by value. Instead, it's organized into a frequency table showing how many times each value occurs. You can still calculate mean absolute deviation in this case — you just need to account for frequency along the way.
Grouped Data Formula
MAD = Σ(f × |x - x̄|) / Σf
f — the frequency, or how many times a value occurs
x — each unique value in the table
x̄ — the mean of the full data set
Σf — the total number of data points, found by adding every frequency
Here's a short example: a teacher surveys 10 students about how many siblings they have.
| Siblings (x) | Number of Students (f) |
|---|---|
| 0 | 2 |
| 1 | 4 |
| 2 | 3 |
| 3 | 1 |
Step 1: Find the mean, weighting each
value by its frequency:
(0×2 + 1×4 + 2×3 + 3×1) ÷ 10 = (0 + 4 + 6 + 3) ÷ 10 = 13 ÷
10 = 1.3
Step 2: Find the absolute deviation for each value, then multiply by that value's frequency:
| Siblings (x) | Frequency (f) | |x − mean| | f × |x − mean| |
|---|---|---|---|
| 0 | 2 | 1.3 | 2.6 |
| 1 | 4 | 0.3 | 1.2 |
| 2 | 3 | 0.7 | 2.1 |
| 3 | 1 | 1.7 | 1.7 |
Step 3: Add the last column, then divide by the total
frequency:
(2.6 + 1.2 + 2.1 + 1.7) ÷ 10 = 7.6 ÷ 10 = 0.76
The mean absolute deviation is 0.76 siblings — a small number, which makes sense since most students in this group have either 0 or 1 siblings, close to the group's average.
Mean Absolute Deviation vs Standard Deviation vs Variance
Mean absolute deviation isn't the only way to measure spread. Two other measures, variance and standard deviation, show up constantly in statistics, and it helps to know how all three relate to each other.
| Measure | How It's Calculated | Sensitive to Outliers? | Units |
|---|---|---|---|
| Mean Absolute Deviation | Average of the absolute deviations from the mean | Less sensitive | Same as original data |
| Variance | Average of the squared deviations from the mean | Very sensitive | Squared units |
| Standard Deviation | Square root of the variance | Very sensitive | Same as original data |
The biggest practical difference comes down to how each measure treats large deviations. Variance and standard deviation square every deviation before averaging them, so a value that's far from the mean has an outsized effect on the final result. Mean absolute deviation treats every unit of distance the same, whether a value is slightly off or wildly off, which makes it a bit more resistant to a single unusual outlier skewing the whole picture.
Standard deviation is still the more commonly used measure in advanced statistics, largely because of how well it works with the normal distribution and other statistical models. Mean absolute deviation remains a genuinely useful, easier-to-calculate alternative, especially when you're first learning about variability. For a deeper side-by-side comparison, see our guide on mean absolute deviation vs standard deviation.
If you want to keep exploring measures of spread, our Z Score Calculator shows how standard deviation pinpoints exactly where one value falls within a data set.
And once you're ready to test whether a difference between two groups is meaningful, rather than just due to chance, our P Value Calculator picks up right where descriptive statistics like MAD leave off.
Common Mistakes When Calculating Mean Absolute Deviation
Even a straightforward formula leaves room for small errors. Here's what tends to trip people up:
- Forgetting to take the absolute value. If you skip this step, your positive and negative deviations cancel out and you'll always end up with zero, no matter what the data actually looks like.
- Rounding too early. Round only your final answer. Rounding the mean or the individual deviations partway through can shift your final result.
- Mixing up mean absolute deviation with standard deviation. Squaring the deviations instead of taking their absolute value gives you a completely different number, using a completely different formula.
- Forgetting to weight grouped data by frequency. When working from a frequency table, skipping the multiplication by frequency will give you an incorrect total.
- Using the wrong total for n. For grouped data, n is the sum of all the frequencies, not the number of rows in your table.
Real-World Uses of Mean Absolute Deviation
Mean absolute deviation isn't just a classroom exercise. It's a practical way to measure consistency in situations where that consistency actually matters.
- Quality control: manufacturers use it to check how consistent product measurements are — a lower MAD in something like bottle fill volume or part dimensions usually signals a more reliable production process.
- Weather reporting: meteorologists use similar measures of spread to describe how much daily temperatures vary from the seasonal average.
- Education: teachers use it to see how consistent a class's test scores are, which can reveal whether most students grasped a lesson evenly or whether performance varied widely.
- Finance: analysts sometimes use mean absolute deviation to describe how much a stock's returns bounce around their average, as a simpler alternative to standard deviation.
- Sports statistics: analysts use it to describe how consistent a player's performance is from game to game, rather than just looking at a season average.
Related Calculators
Put what you just read into practice, try these free tools instantly, no sign-up required.
Interval of Convergence Calculator
Find the interval of convergence for any power series.
Mean Absolute Deviation Calculator
Calculate the mean absolute deviation for any data set.
P Value Calculator
Calculate the p-value for your hypothesis test statistic.
Volume of a Sphere Calculator
Calculate the volume of a sphere from its radius or diameter.
Z Score Calculator
Calculate the z-score for a value within a normal distribution.
Using a Mean Absolute Deviation Calculator
Working through the steps by hand is the best way to understand what mean absolute deviation actually measures, but once you're comfortable with the process, a calculator saves time, especially with larger data sets.
Free Online Tool
Skip the manual arithmetic
100 Calculator's Mean Absolute Deviation Calculator lets you enter your full data set and instantly see the mean, every deviation, and the final MAD result, laid out the same way this guide walks through it. It's a fast way to check homework or handle a data set too large to comfortably calculate by hand.
A calculator is also useful for catching your own mistakes. If you calculate mean absolute deviation by hand and then check it against the calculator's result, any mismatch usually points to one of the common errors covered earlier in this guide, like forgetting an absolute value or rounding too early.
Interpreting Your Mean Absolute Deviation Result
Once you have a mean absolute deviation number, the next question is what it actually tells you. There's no universal "good" or "bad" MAD value, since it depends entirely on the scale of your data and what you're comparing it to.
Comparing MAD Within the Same Data Type
MAD is most useful when you're comparing it against something: another data set measured the same way, a previous time period, or a known target range. If one class's test scores have a MAD of 4 points and another class's have a MAD of 12 points, the second class's scores are clearly more spread out, even without knowing anything else about either class.
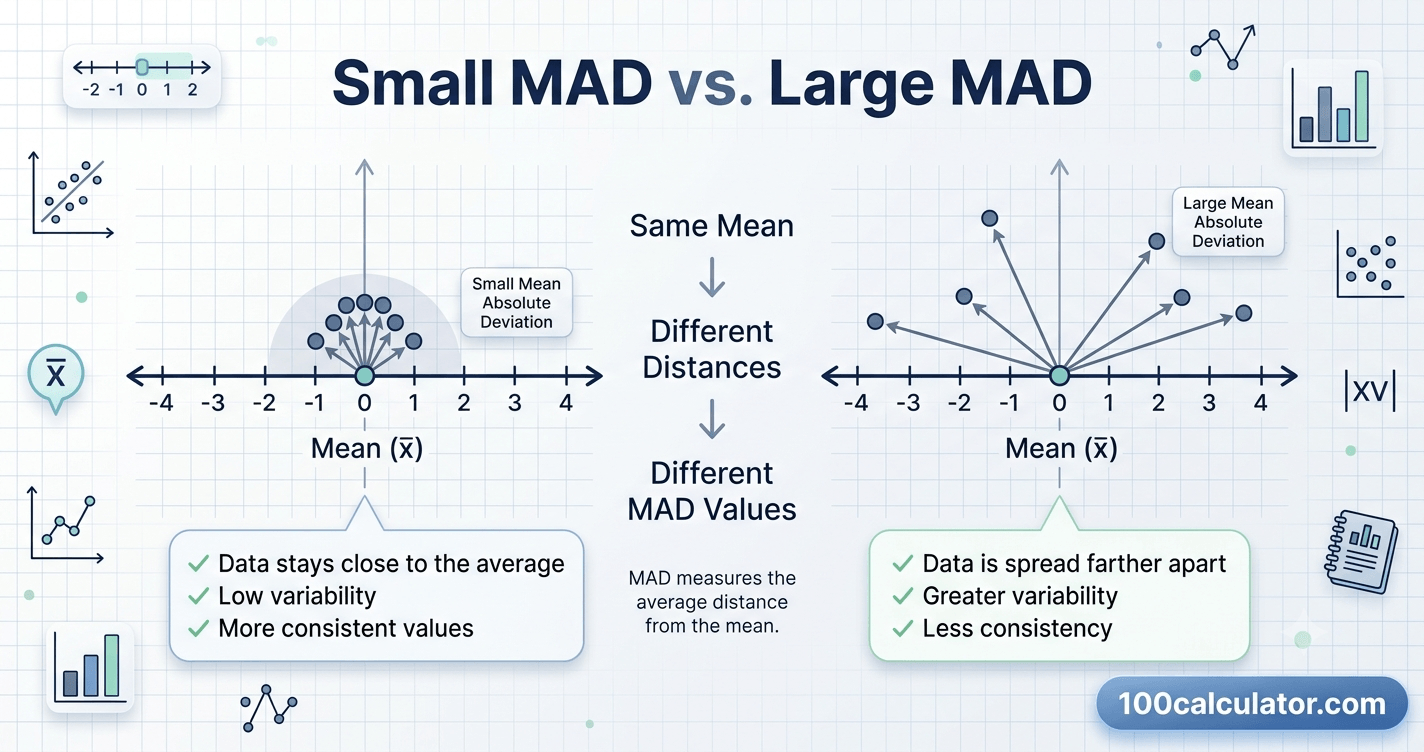
What a Small vs Large MAD Suggests
- A small MAD means most values sit close to the mean, suggesting consistency.
- A large MAD means values are more spread out, suggesting more variability.
- A MAD of zero means every value in the data set is identical, which is rare outside of very small or highly controlled data sets.
More From Math & Statistics Guides
Still building your statistics toolkit? These related guides dig deeper into the topics covered above.
Frequently Asked Questions
What is mean absolute deviation?
Mean absolute deviation (MAD) is a measure of how spread out a set of numbers is around their average. You calculate it by finding the average distance between each data point and the mean, ignoring whether that distance is positive or negative. A small MAD means the values are clustered close to the mean; a large MAD means they're more spread out. It's one of several ways statisticians describe variability, alongside variance and standard deviation.
How do you calculate mean absolute deviation step by step?
To calculate mean absolute deviation, first find the mean of your data set by adding all the values and dividing by how many there are. Next, subtract the mean from each individual value and take the absolute value of each result, which removes any negative signs. Then add up all of those absolute deviations. Finally, divide that sum by the total number of data points to get your mean absolute deviation.
What is the formula for mean absolute deviation?
The formula is MAD = Σ|x − x̄| / n. Here, x represents each individual data value, x̄ is the mean of the data set, the vertical bars mean you take the absolute value, Σ tells you to add everything up, and n is the total number of data points. In plain terms, it's the average of all the absolute distances between each value and the mean.
What is a good mean absolute deviation value?
There's no single "good" MAD value, since it depends entirely on the scale and context of your data. A MAD of 2 might be small for a data set measured in the thousands, but large for a data set where most values sit between 0 and 5. The best way to judge a MAD is to compare it against the mean itself, or compare it to the MAD of a similar data set you're measuring against.
Is a lower mean absolute deviation better?
Not necessarily "better," just different. A lower MAD simply means your data points are more tightly clustered around the mean, which is useful when you want consistency, like manufacturing tolerances or steady test scores. A higher MAD isn't a mistake; it just reflects more variability. Whether that's good or bad depends on what you're measuring and what you're hoping to see.
What's the difference between mean absolute deviation and standard deviation?
Mean absolute deviation uses absolute values to measure how far data points are from the mean, while standard deviation squares those distances, averages them, and then takes the square root. Because standard deviation squares the deviations, it reacts more strongly to outliers than MAD does. Standard deviation is used more often in advanced statistics, but MAD is often easier to understand and calculate by hand.
Can mean absolute deviation be negative?
No. Mean absolute deviation is always zero or a positive number. This is because the formula specifically takes the absolute value of each deviation before averaging them, which cancels out any negative signs. A MAD of zero would only happen if every value in the data set were exactly equal to the mean, meaning there's no variation at all.
How do you find mean absolute deviation from a frequency table?
For grouped or frequency data, multiply each value's absolute deviation from the mean by its frequency, add up those results, then divide by the total number of data points, which is the sum of all frequencies. The formula is MAD = Σf|x − x̄| / Σf, where f is the frequency of each value. This weights values that occur more often more heavily in the final result.
Is mean absolute deviation the same as average deviation?
Yes, "mean absolute deviation" and "average deviation" are generally used to mean the same thing, though MAD is the more precise and commonly used term in textbooks and statistics courses. Both describe the average distance between each data point and the mean, calculated using absolute values so that positive and negative deviations don't cancel each other out.
Do you use the mean or the median for mean absolute deviation?
Standard mean absolute deviation, and the version used in most introductory statistics courses, is calculated using the mean. Some statisticians also calculate a version using the median instead, sometimes called the "median absolute deviation," which can be more resistant to extreme outliers. Unless a problem specifically asks for the median version, assume MAD refers to the mean-based calculation.
What is mean absolute deviation used for in real life?
Mean absolute deviation shows up anywhere consistency matters. Businesses use it to track how much daily sales or production numbers vary from average. Teachers use it to see how spread out test scores are in a class. Investors sometimes use it to gauge how much a stock's returns bounce around their average. Anywhere you want a simple, easy-to-explain measure of variability, MAD is a solid option.
How is mean absolute deviation different from variance?
Variance measures spread by squaring each deviation from the mean before averaging them, which makes larger deviations count disproportionately more. Mean absolute deviation, by contrast, just takes the absolute value of each deviation, so every unit of distance from the mean counts equally. Variance is also expressed in squared units, while MAD stays in the same units as your original data, which many people find easier to interpret.
What does a mean absolute deviation of zero mean?
A mean absolute deviation of zero means every value in your data set is identical to the mean, so there's no variation at all. In practice, this is rare outside of very small or artificially uniform data sets. Even a small amount of natural variation, like slightly different test scores or measurements, will produce a MAD greater than zero.
Can you calculate mean absolute deviation for negative numbers?
Yes. Mean absolute deviation works the same way whether your data set includes negative numbers, positive numbers, or both. You still find the mean of the full data set first, then calculate each value's absolute distance from that mean. The absolute value step means the final MAD result is always zero or positive, regardless of whether your original data included negative numbers.
Is there a free mean absolute deviation calculator I can use online?
Yes. 100 Calculator's free Mean Absolute Deviation Calculator lets you enter your data set and instantly see the mean, each absolute deviation, and the final result, without doing the arithmetic by hand. It's useful for checking homework, working with larger data sets, or confirming a calculation you did manually using the steps in this guide.
Why do we use absolute value instead of just subtracting?
If you simply subtracted the mean from each value and averaged the results without using absolute value, the positive and negative deviations would cancel each other out, always producing an answer of zero. Taking the absolute value first ensures that every deviation, whether a value falls above or below the mean, adds to the total instead of canceling it. That's what makes mean absolute deviation an accurate measure of spread.
About 100 Calculator
100 Calculator is a free hub of online calculators and educational guides covering health, finance, trading, crypto, education, math, and more. Every tool is built to be fast, accurate, and genuinely free, with no account or signup required.
We built this guide, and tools like the Mean Absolute Deviation Calculator referenced throughout it, to make everyday math and statistics questions a little easier to work through. Head back to the 100 Calculator homepage to explore the full library of tools, or learn more about the team behind them on our About Us page.