How to Use Z Scores to Compare Different Data Sets
A beginner-friendly walkthrough of what a z-score actually measures, how to calculate one by hand, and how to use z-scores to fairly compare values from two completely different data sets.
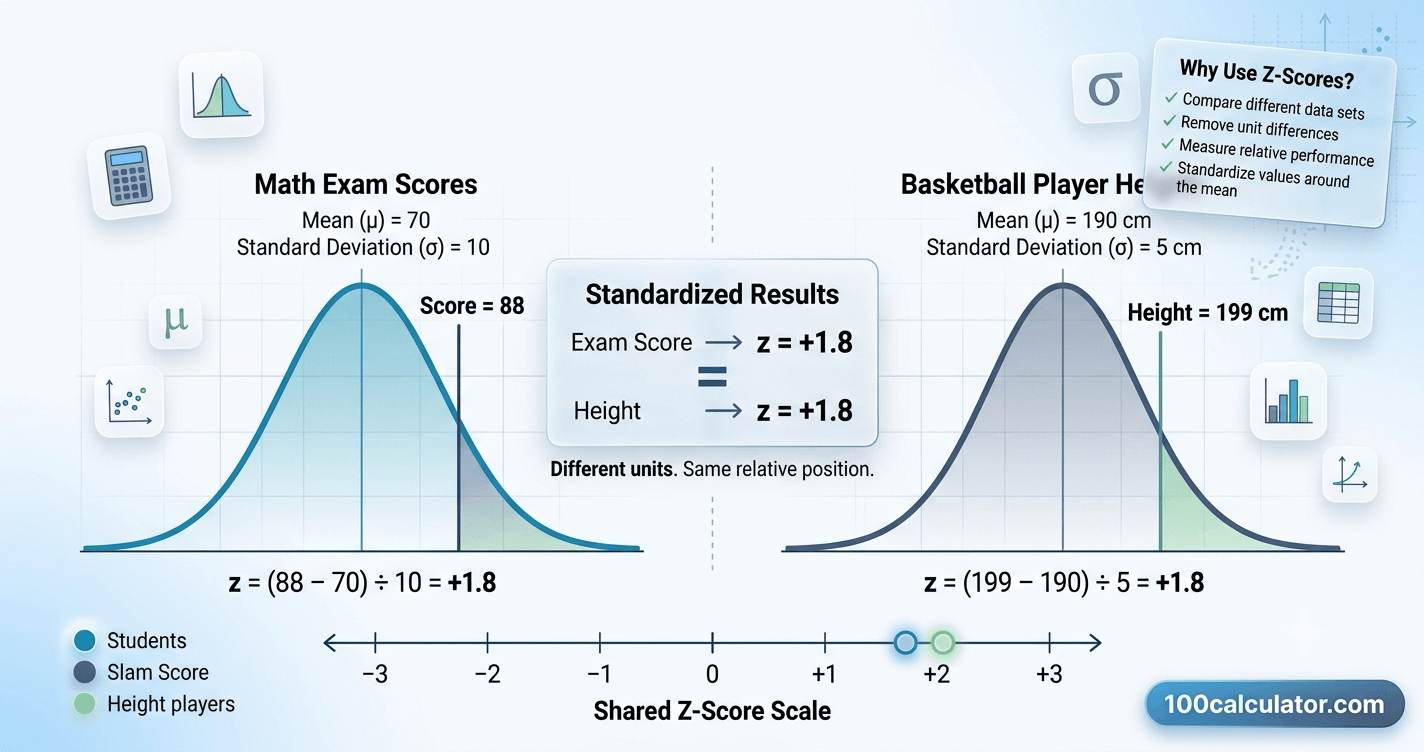
Say two students each took a different test. One scored 82. The other scored 88. It looks like the second student did better — but not necessarily, and not until you know what "normal" looked like on each test.
A z-score tells you how far a single value sits from the average of its group, measured in standard deviations. Once you convert two results into z-scores, you can compare them directly, even if they came from completely different tests, scales, or units. A z-score of 0 means a value sits exactly at the average. A positive z-score means it's above average, and a negative one means it's below average. The math itself is simple: subtract the mean from your value, then divide by the standard deviation.
This is exactly what a Z Score Calculator does behind the scenes, and it's a big part of why z-scores show up everywhere from school report cards to medical growth charts to financial risk models.
In this guide, we'll cover what a z-score actually measures, how to calculate one by hand, and — most importantly — how to use z-scores to compare two different data sets fairly. We'll work through a full example step by step, cover the empirical rule, and flag the most common mistakes people make when standardizing data for comparison.
What Is a Z-Score? (The Basics)
A z-score, also called a standard score, describes exactly where a single data point falls compared to the rest of its data set. Instead of saying "this value is 82," a z-score says "this value is 1 standard deviation above average" — which turns out to be a far more useful way to think about numbers.
Standard deviation measures how spread out a group of values is. A small standard deviation means most values sit close to the average. A large one means values are scattered more widely. Once you know both the mean and the standard deviation of a data set, you have everything you need to turn any raw value into a z-score.
If you want the fuller picture of what a z-score represents on its own, our guide on what a z-score means and how to calculate it correctly covers the concept from the ground up. This article builds on that foundation and focuses specifically on using z-scores to compare two different data sets.
The Z-Score Formula
The formula for a population z-score is:
Population Formula
z = (x − μ) / σ
Use this version when you have data for an entire population — every member of the group, not just a sample of it.
For a sample instead of a full population, the formula uses slightly different symbols but works exactly the same way:
Sample Formula
z = (x − x̄) / s
Use this version when you're working with a sample drawn from a larger population — this is the version most calculators, including our Z Score Calculator, use by default.
What Each Part of the Formula Means
Here's what each symbol in the formula stands for:
| Symbol | Name | What It Means |
|---|---|---|
| x | Raw score | The specific value you want to standardize |
| μ (mu) | Population mean | The average of the entire population |
| σ (sigma) | Population standard deviation | How spread out the population's values are |
| x̄ (x-bar) | Sample mean | The average of a sample drawn from the population |
| s | Sample standard deviation | How spread out the sample's values are |
| z | Z-score | The number of standard deviations x is from the mean |
Why Z-Scores Let You Compare Completely Different Data Sets
This is the real reason z-scores are worth learning. Once you understand this part, the rest of the guide is just mechanics.
The Problem With Comparing Raw Numbers
Raw numbers alone don't tell you much on their own. A score of 88 sounds better than a score of 82, but that assumes both numbers come from the same scale, with the same average and the same spread. Test scores rarely work that way.
The problem gets even more obvious once the units themselves are different. There's no meaningful way to compare a height of 170 centimeters to a weight of 65 kilograms — the two numbers aren't measuring the same thing, so lining them up side by side tells you nothing.
Z-scores solve both problems at once. They strip away the original units and scale, and replace them with a single, shared measurement: how far a value sits from its own group's average, in standard deviation units.
How Standardizing Solves It
Subtracting the mean centers every data set at 0. Dividing by the standard deviation rescales it so that "1 unit" always means "1 standard deviation," no matter what the original units were.
Once two data sets go through this process, they land on the exact same scale: a mean of 0 and a standard deviation of 1. Two completely different test scores become directly comparable — not because the underlying numbers are similar, but because both have been converted to answer the exact same question: how unusual is this value, relative to its own group?
How to Calculate a Z-Score, Step by Step
Calculating a z-score by hand takes four steps.
- Find the mean of the data set. Add up every value and divide by how many values there are.
- Find the standard deviation of the data set. This measures how spread out the values are around the mean. Our guide on mean absolute deviation vs standard deviation is a good refresher if you need to calculate this piece from scratch.
- Subtract the mean from your value. This tells you the raw distance between your value and the average.
- Divide that result by the standard deviation. This converts the raw distance into standard deviation units — your z-score.
Free Online Tool
Skip the manual math
100 Calculator's Z Score Calculator does the subtraction and division for you. Enter your value, mean, and standard deviation, and get your z-score instantly, with no signup required. If you still need to find the standard deviation itself, the Mean Absolute Deviation Calculator can help with that piece too.
Population vs Sample Z-Scores
Use the population formula (μ and σ) only when you have data on every member of the group you care about — every student in one specific class, for example. In most real-world situations, you're working with a sample instead — a smaller subset of a larger group, like a survey of 200 people out of a city of 200,000. In that case, use the sample formula (x̄ and s).
The good news: the math works the same way either way. The only thing that changes is where your mean and standard deviation come from.
Worked Example: Comparing Two Different Data Sets With Z-Scores
Here's the exact situation this guide opened with. A student takes two different tests and wants to know which one they actually did better on, relative to their classmates.
Step 1: Find the Mean and Standard Deviation for Each Data Set
| Test | Student's Score | Class Mean | Class Standard Deviation |
|---|---|---|---|
| Math | 82 | 74 | 8 |
| Science | 88 | 76 | 6 |
Both tests are scored out of 100, but they clearly weren't graded the same way — the science class average is higher, and the scores in that class are more tightly clustered around the mean, since its standard deviation is smaller.
Step 2: Calculate Each Z-Score
Working through the formula for each test:
Math Test
z = 1.0
Score: 82 (Mean: 74, SD: 8)
82 is exactly 1 standard deviation above the class average: (82 − 74) / 8 = 1.0
Science Test
z = 2.0
Score: 88 (Mean: 76, SD: 6)
88 is exactly 2 standard deviations above the class average: (88 − 76) / 6 = 2.0
Step 3: Compare the Z-Scores, Not the Raw Scores
Looking only at the raw numbers, 88 beats 82. But that comparison was never quite valid in the first place — these are two different tests, graded on two different curves.
Once both scores are converted to z-scores, a clearer picture appears. The math z-score is 1.0. The science z-score is 2.0. Even though the raw science score is higher, the size of the gap above average is what matters here — and the science result is twice as many standard deviations above the mean as the math result. Relative to classmates, this student's science performance was more unusual, meaning stronger, than their math performance, even though the raw numbers might suggest something different at a glance.
How to Read and Interpret a Z-Score
Positive vs Negative Z-Scores
A positive z-score means the value sits above the mean. A negative z-score means it sits below the mean. A z-score of exactly 0 means the value is the mean.
The size of the number matters more than most people expect. A z-score of 0.2 is barely different from average. A z-score of 3 is dramatically different, rare enough that it stands out from almost everything else in the data set.
What Counts as a High or Low Z-Score
As a general guide:
| Z-Score Range (Absolute Value) | What It Suggests |
|---|---|
| Less than 1 | Fairly typical, within normal variation |
| 1 to 2 | Somewhat unusual, but still fairly common |
| 2 to 3 | Fairly rare, often worth a second look |
| Greater than 3 | Very rare, often treated as a possible outlier |
The Empirical Rule: Understanding 68-95-99.7
For data that follows a roughly normal, bell-shaped distribution, statisticians rely on a simple pattern called the empirical rule, sometimes called the 68-95-99.7 rule:
- About 68% of values fall within 1 standard deviation of the mean (z between -1 and 1)
- About 95% of values fall within 2 standard deviations of the mean (z between -2 and 2)
- About 99.7% of values fall within 3 standard deviations of the mean (z between -3 and 3)
This is exactly why a z-score beyond ±2 tends to raise eyebrows, and a z-score beyond ±3 is often flagged as a likely outlier — fewer than half a percent of values in a normal distribution land out that far.
Z-Scores vs Percentiles
Z-scores and percentiles both describe where a value falls relative to a group, but they answer slightly different questions. A z-score measures distance from the mean, in standard deviations. A percentile tells you what share of the data falls below a given value.
For data that's roughly normally distributed, the two are directly connected:
| Z-Score | Approximate Percentile |
|---|---|
| -2 | 2nd percentile |
| -1 | 16th percentile |
| 0 | 50th percentile |
| 1 | 84th percentile |
| 2 | 98th percentile |
A z-table, or standard normal table, is what statisticians traditionally used to look up these conversions before calculators made it instant.
Common Mistakes When Using Z-Scores to Compare Data
Even with the right formula, a few habits can quietly throw off a comparison. Here's what to watch for:
- Comparing raw scores instead of z-scores. If two data sets use different scales, the raw numbers alone can't tell you which value is relatively stronger.
- Mixing population and sample formulas inconsistently. Use the same approach, population or sample, for both data sets you're comparing, or the comparison won't be apples to apples.
- Assuming a positive z-score always means "better." A high z-score means "further from average" — whether that's good or bad depends entirely on what's being measured. A negative z-score on a race time might mean a faster finish.
- Treating percentile conversions as exact for skewed data. The z-score to percentile relationship assumes a roughly normal distribution, and heavily skewed data breaks that assumption.
- Forgetting that small samples produce shaky results. A single unusual value in a small data set can swing both the mean and the standard deviation, which throws off every z-score calculated from it.
Real-World Uses for Z-Scores
Z-scores aren't just a classroom exercise. They show up anywhere someone needs to judge a value against a typical range, rather than looking at it in isolation.
Standardized Testing
Z-scores are part of why standardized tests can be compared across different versions, question sets, and even different tests entirely. Once individual scores are converted to a shared standardized scale, admissions offices and researchers can compare an applicant's relative performance, not just their raw number.
Growth Charts in Healthcare
Pediatric growth charts often use z-scores to compare a child's height, weight, or head circumference to other children of the same age and sex. A z-score close to 0 suggests a measurement close to typical for that age group, while a z-score far from 0 in either direction is something a doctor may want to look into further.
Finance and Investment Analysis
In finance, z-scores help compare how unusual a return or price movement is relative to an asset's own typical behavior. A single-day move that looks large in raw percentage terms might be completely ordinary for a volatile asset, while a small move might be unusually large for a normally stable one. A z-score puts both in context.
Quality Control and Manufacturing
Manufacturers use z-scores to flag products that fall outside expected specifications. A part with a measurement several standard deviations from the target value is a strong candidate for closer inspection, even if the raw number alone wouldn't obviously stand out.
Data Science and Machine Learning
Before training many machine learning models, data scientists standardize their features into z-scores. This keeps a variable measured in the thousands, like income, from dominating a variable measured in single digits, like age, purely because of its scale.
Hypothesis Testing and Statistical Significance
Z-scores are also a building block of hypothesis testing, where they help determine whether a result is likely due to chance or reflects a real effect. This connects closely to p-values — our guides on what a p-value really tells you about significance and how to interpret a p-value in hypothesis testing dig deeper into that relationship, and our P Value Calculator can help once you're ready to apply it.
Z-Score vs Standard Deviation vs Raw Score: What's the Difference?
| Term | What It Tells You | Example |
|---|---|---|
| Raw score | The actual, unmodified value | 82 out of 100 |
| Standard deviation | How spread out the whole data set is | 8 points |
| Z-score | How far the raw score sits from the mean, in standard deviation units | 1.0 |
These three numbers work together, but they answer different questions. The raw score tells you what happened. The standard deviation tells you how much variation is normal for that group. The z-score combines both to tell you how that particular result compares to everyone else's.
When Z-Scores Don't Work Well
Z-scores are a genuinely useful tool, but they come with a few real limitations worth knowing about.
- They assume a roughly normal distribution. The empirical rule and percentile estimates lean on that assumption. For heavily skewed data, those specific interpretations become less reliable, even though the z-score itself is still mathematically valid.
- They're sensitive to outliers. Since both the mean and the standard deviation come from the same data, one extreme value can distort the whole scale, which in turn skews every z-score calculated from it.
- They need a reasonably sized data set. Very small samples produce mean and standard deviation estimates that can shift a lot from one data point to the next. Our guide on how to calculate mean absolute deviation step by step walks through a related way of measuring spread that runs into the same sample-size issue.
- They don't explain why a value is different. A z-score tells you how unusual a result is, not what caused it. That part still requires context and judgment.
- Comparability still has to make sense. Standardizing a height and a test score both produce valid z-scores, but deciding what a side-by-side comparison of the two would even mean is a separate question the math can't answer for you.
Related Calculators
Put what you just read into practice, try these free tools instantly, no sign-up required.
Interval of Convergence Calculator
Find the interval of convergence for any power series.
Mean Absolute Deviation Calculator
Calculate the mean absolute deviation for any data set.
P Value Calculator
Calculate the p-value for your hypothesis test statistic.
Volume of a Sphere Calculator
Calculate the volume of a sphere from its radius or diameter.
Z Score Calculator
Calculate the z-score for a value within a normal distribution.
Quick Reference: Using Z-Scores With Confidence
A short recap before you put this into practice:
- Find the mean and standard deviation of each data set you want to compare
- Subtract the mean from your value, then divide by the standard deviation
- Compare the resulting z-scores, not the original raw numbers
- Remember that a higher z-score means "further from average," not automatically "better"
- Use the empirical rule as a quick gut-check for how unusual a z-score really is
- Double-check that both data sets used the same approach, population or sample, before comparing them directly
Once your numbers are ready, 100 Calculator's Z Score Calculator takes care of the arithmetic, so you can spend your time interpreting the result instead of double-checking your subtraction.
More From Our Math & Statistics Guides
Still building your statistics toolkit? These related guides dig deeper into the concepts covered above.
Frequently Asked Questions
What does a z-score tell you?
A z-score tells you how many standard deviations a specific value is from the mean of its data set. A z-score of 0 means the value equals the average. A positive z-score means it's above average, and a negative z-score means it's below average. Because z-scores are standardized, they let you compare values from different data sets, even when those data sets use completely different scales or units.
How do you calculate a z-score by hand?
Subtract the mean of the data set from your value, then divide the result by the standard deviation. The formula is z = (x − μ) / σ for a population, or z = (x − x̄) / s for a sample. For example, if a value is 82, the mean is 74, and the standard deviation is 8, the z-score is (82 − 74) / 8, which equals 1.0.
What does a z-score of 0 mean?
A z-score of 0 means the value is exactly equal to the mean of the data set. It's neither above nor below average — it sits right at the center of the distribution. This is the baseline every other z-score is measured against.
Can a z-score be negative, and what does that mean?
Yes, z-scores are negative whenever a value falls below the mean. A z-score of -1 means the value is one standard deviation below average, and a z-score of -2 means it's two standard deviations below average. A negative z-score isn't automatically a bad result — whether it's good or bad depends entirely on what you're measuring.
What is considered a high or unusual z-score?
Most statisticians treat a z-score with an absolute value above 2 as somewhat unusual, and above 3 as a likely outlier. In a roughly normal distribution, about 95% of values fall between z-scores of -2 and 2, so anything outside that range stands out from the typical pattern.
How do z-scores let you compare different data sets?
Z-scores convert values from any data set onto the same standardized scale, where the mean is always 0 and the standard deviation is always 1. Once two values are expressed as z-scores, you're comparing how unusual each one is relative to its own group, instead of comparing raw numbers that may come from completely different scales.
What is the difference between a z-score and a raw score?
A raw score is the original, unmodified value, like a test score of 82 out of 100. A z-score converts that raw score into a standardized measurement showing how far it sits from the mean, in standard deviation units. The raw score alone doesn't tell you whether 82 is a strong result; the z-score does.
What is the difference between a z-score and a percentile?
A z-score measures distance from the mean in standard deviations, while a percentile shows what percentage of the data falls below a given value. The two are related — for data that's roughly normally distributed, a z-score of 0 corresponds to about the 50th percentile, and a z-score of 1 corresponds to roughly the 84th percentile.
What is the empirical rule (68-95-99.7 rule)?
The empirical rule describes how data spreads out in a normal distribution. About 68% of values fall within one standard deviation of the mean, about 95% fall within two standard deviations, and about 99.7% fall within three standard deviations. It's a quick way to judge how typical or unusual a given z-score is.
What counts as an outlier based on z-score?
There's no single official cutoff, but a z-score beyond +3 or -3 is commonly treated as a likely outlier, since fewer than 0.3% of values in a normal distribution fall that far from the mean. Some fields use a stricter threshold, like z-scores beyond ±2, depending on how sensitive the analysis needs to be.
What is the difference between a population z-score and a sample z-score?
A population z-score uses the mean (μ) and standard deviation (σ) of an entire population, while a sample z-score uses the mean (x̄) and standard deviation (s) of a smaller sample drawn from that population. The formula works the same way in both cases — only the symbols and the source of the data change.
Do you need a normal distribution to use z-scores?
You can calculate a z-score for any data set, regardless of its shape. However, the common interpretations tied to z-scores, like the empirical rule and percentile estimates, assume the data is roughly normally distributed. For heavily skewed data, a z-score is still mathematically valid, but those percentage-based interpretations become less reliable.
Can you calculate a z-score without knowing the standard deviation?
No, the standard deviation is a required part of the z-score formula. Without it, you can find how far a value is from the mean in raw terms, but you can't express that distance in standardized units. If you only have raw data, you'll need to calculate the standard deviation first.
What is a z-table, and when would you use one?
A z-table, or standard normal table, lists the percentage of data that falls below a given z-score in a standard normal distribution. It's used to convert a z-score into a percentile or probability without doing the underlying calculation by hand, which is common in statistics coursework and hypothesis testing.
What is the difference between a z-score and a t-score?
A z-score assumes you know the population standard deviation and typically works best with larger samples, while a t-score is used when the population standard deviation is unknown and estimated from a smaller sample. T-scores come from the t-distribution, which has heavier tails than the normal distribution to account for that added uncertainty.
Why does the z-score formula divide by standard deviation?
Dividing by the standard deviation rescales the distance between a value and the mean into standardized units. Without this step, a difference of 8 points would mean something different on a test with a standard deviation of 4 than on one with a standard deviation of 20. Dividing puts every data set on the same comparable scale.
Can z-scores compare test scores from two completely different tests?
Yes, this is one of the most common uses for z-scores. As long as you know the mean and standard deviation for each test, you can convert both scores into z-scores and compare them directly, even if the tests use entirely different scoring scales, question formats, or difficulty levels.
Is a negative z-score always a bad result?
Not necessarily. Whether a negative z-score is good or bad depends on what's being measured. A negative z-score for a race time could mean a faster-than-average finish, which is a good result, while a negative z-score on a test typically means a below-average score. Always consider the context before judging a z-score as good or bad.
How many data points do you need before z-scores are reliable?
There's no strict minimum, but z-scores calculated from very small samples can be unstable, since a single unusual value can shift both the mean and the standard deviation. Larger samples generally produce more stable, trustworthy estimates, which is why z-scores are typically more reliable with dozens of data points rather than just a handful.
Where are z-scores used outside of school or statistics class?
Z-scores show up in medical growth charts, where a child's height or weight is compared to peers of the same age. They're used in manufacturing quality control to flag products that deviate from expected specifications, in finance to compare investment returns, and in data science to standardize features before training machine learning models.
About 100 Calculator
100 Calculator is a free hub of online calculators and educational guides covering health, finance, trading, crypto, education, math, and more. Every tool is built to be fast, accurate, and genuinely free, with no account or signup required.
We built this guide, and tools like the Z Score Calculator referenced throughout it, to make everyday math and statistics questions a little easier to work through. Head back to the 100 Calculator homepage to explore the full library of tools, or learn more about the team behind them on our About Us page.