What a Z Score Means and How to Calculate It Correctly
A plain-English breakdown of what a z score actually measures, the formula behind it, and how to calculate and interpret one using real numbers.
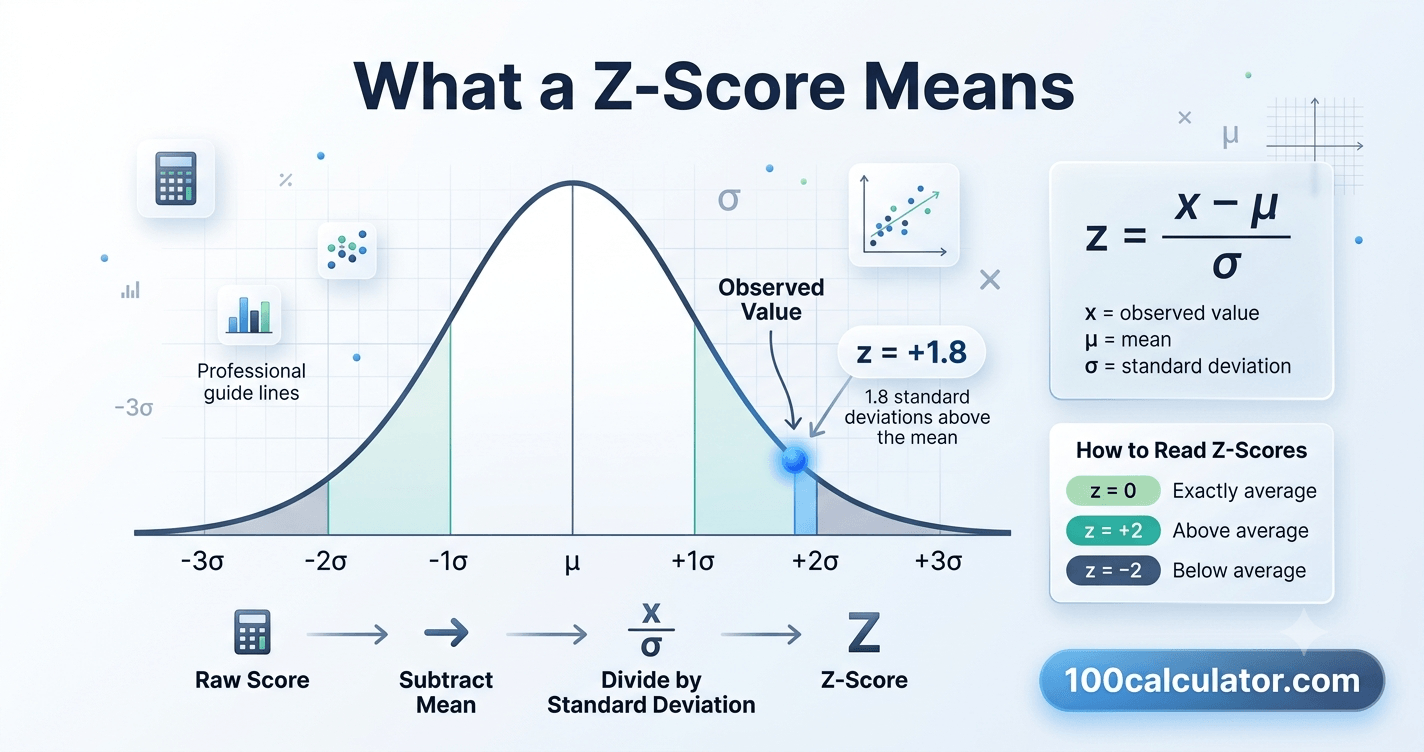
Open a test score report, a pediatric growth chart, or a research paper, and you'll often find a small number labeled "z" sitting next to the result, with no real explanation of what it means. That number is a z score, and once you understand it, a lot of other statistics start making more sense too.
A z score, also called a standard score, tells you how many standard deviations a single value sits above or below the average of its data set. A score of 0 means the value is exactly average, a positive score means it's above average, and a negative score means it's below average. The further the number sits from zero, in either direction, the less typical that value is.
You don't need to be a statistics student to run into z scores. They show up in standardized test results, quality control reports, financial risk models, and plenty of everyday research, usually condensed into a single number without much context.
Below, we'll walk through the exact formula, calculate a z score by hand with real numbers, and cover how to read the result once you have it, including what counts as typical, unusual, or a genuine outlier. If you'd rather skip the manual math, 100 Calculator's Z Score Calculator handles the same calculation instantly. First, let's break down exactly what this number represents.
What Is a Z Score?
A z score is a way of describing exactly where a single value sits within a data set, using the mean and standard deviation as reference points. Instead of just knowing a raw number, like a test score of 87 or a height of 68 inches, a z score tells you how that number compares to everyone else in the group it came from.
The idea is simple once you see it in context. Standard deviation measures how spread out a data set is overall. A z score takes that same measurement and applies it to one specific value, expressing the distance between that value and the mean in standard deviation units, rather than in whatever units the data happens to be measured in.
That last part is what makes z scores so useful. Once a value is converted into a z score, the original units stop mattering. A z score of 1.5 means the same thing whether it came from a test score, a height measurement, or a company's quarterly revenue: the value sits one and a half standard deviations above average.
Why Z Scores Matter
Z scores solve a specific, common problem: comparing values that don't share the same scale. Say two employees are reviewed on completely different metrics — one's performance is measured in dollars of sales, the other's in a customer satisfaction percentage. Comparing $85,000 in sales to a 92% satisfaction score directly tells you nothing useful.
Convert both to z scores against their own team's average and standard deviation, though, and you're suddenly comparing apples to apples: whoever has the higher z score is performing further above their team's typical range, regardless of the original units.
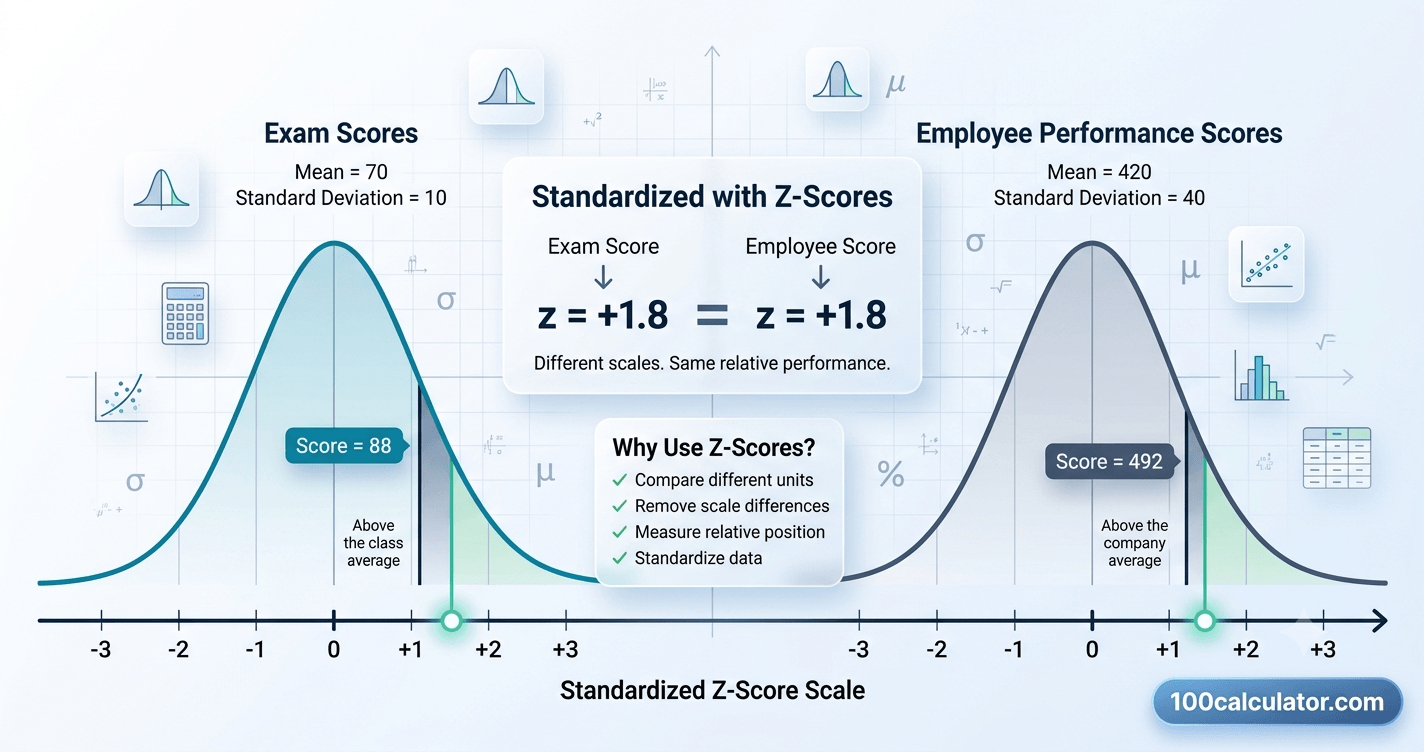
That standardizing power is why z scores show up across so many fields, from education to healthcare to finance. Here's what regular use of z scores gives you:
- A standardized way to compare values from completely different scales or units
- A quick gauge of whether a single result is typical or unusual, without eyeballing the whole data set
- The foundation for percentiles, which are often easier to explain than raw z scores
- A building block for hypothesis testing and other statistical methods used throughout research
- A practical way to flag data entry errors or genuine outliers before they skew an analysis
Once you're comfortable with the basics here, our guide on how to use z scores to compare different data sets goes further into that standardization use case specifically.
The Z Score Formula Explained
The z score formula is short, but each piece of it matters:
Z Score Formula
z = (x − μ) / σ
x = the raw value you're checking
μ (mu) = the mean of the data set
σ (sigma) = the standard deviation of the data set
To use it, subtract the mean from your value, then divide the result by the standard deviation. That's the entire calculation.
If you're working with a full population, μ and σ represent the population mean and population standard deviation. If you're working with a sample instead, which is far more common in practice since you rarely have data on an entire population, the same formula works using the sample mean (often written x̄) and sample standard deviation (s) in place of μ and σ. Our guide on mean absolute deviation vs standard deviation covers how standard deviation itself gets calculated, or 100 Calculator's Mean Absolute Deviation Calculator can help you check your spread numbers first.
The result, z, can be positive, negative, or exactly zero, and it's almost always expressed in standard deviation units rather than the original units of the data.
How to Calculate a Z Score Step by Step
Here's the full process broken into steps, followed by a worked example with real numbers.
- Find the mean (μ) of your data set. Add up every value, then divide by how many values there are.
- Find the standard deviation (σ). This measures how spread out the values are around that mean. If you don't already have it, you'll need to calculate it before moving forward.
- Subtract the mean from your value: x − μ.
- Divide that result by the standard deviation: (x − μ) / σ.
- The number you get is the z score for that value.
Worked Example
Say a class takes a math test. The average score comes out to 75, with a standard deviation of 8. One student scores 87. Here's how to find that student's z score:
z = (87 − 75) / 8
z = 12 / 8
z = 1.5
That student's score sits 1.5 standard deviations above the class average — solidly above typical, but nowhere near outlier territory. If a different student scored 59, their z score would be (59 − 75) / 8 = -2, meaning their score fell two full standard deviations below average.
Free Online Tool
Prefer not to do the division by hand?
100 Calculator's Z Score Calculator does this same calculation instantly. Enter your value, the mean, and the standard deviation, and it returns the z score along with the percentile it corresponds to.
How to Interpret a Z Score
Once you have a z score, its sign and size tell you everything you need to know. Here's a quick reference for how to read one:
-1 to +1
Typical
About 68% of values fall in this range. Nothing unusual about a value here.
±1 to ±2
Somewhat Unusual
Still fairly common, but this value stands out from most of the group.
±2 to ±3
Rare
Only about 5% of values land out here — usually worth a second look.
Beyond ±3
Extreme
Fewer than 0.3% of values reach this far. Often flagged as a potential outlier.
What Counts as an Outlier?
There's no single official cutoff for what makes a value a statistical outlier, but a common rule of thumb treats z scores beyond +3 or -3 as potential outliers, since so little of a normal distribution falls out that far. Some fields, especially those dealing with quality control or safety, use a tighter threshold around ±2.5.
Whether a value truly counts as an outlier also depends on your sample size and whether the underlying data is roughly normally distributed in the first place. A genuinely skewed data set can produce large z scores that aren't outliers at all, just a natural feature of that data's shape.
Z Scores and the Normal Distribution
Z scores are most useful, and most commonly discussed, in the context of a normal distribution: the symmetric, bell-shaped curve that shows up constantly in nature and in large data sets, from heights and test scores to measurement errors and manufacturing tolerances.
When data follows a normal distribution, converting every value to a z score transforms that data onto something called the standard normal distribution: a bell curve with a mean of exactly 0 and a standard deviation of exactly 1. That transformation is what makes z-tables and percentile lookups work consistently across completely different original data sets.
The Empirical Rule (68-95-99.7 Rule)
This predictable spread is often summarized as the empirical rule, sometimes called the 68-95-99.7 rule. The (NIST) e-Handbook of Statistical Methods describes this same pattern: in a normal distribution, about 68% of values fall within 1 standard deviation of the mean, about 95% fall within 2 standard deviations, and about 99.7% fall within 3 standard deviations.
That's a handy shortcut. Once you know a value's z score, you immediately know roughly how common or rare it is, without needing to look anything up. A z score of 2, for instance, means that value is higher than roughly 97.7% of the data, since the 95% figure covers ±2 combined and the remaining 5% splits evenly between both tails.
Positive, Negative, and Zero Z Scores
The sign of a z score is just as important as its size, since it tells you which direction a value differs from average.
A positive z score means the value is above the mean. The larger the positive number, the further above average it sits. A z score of +2 is further above average than a z score of +0.5.
A negative z score means the value is below the mean. The same logic applies in reverse: a z score of -2 is further below average than a z score of -0.5. It's easy to accidentally compare the size of two z scores while ignoring their signs, which is one of the most common interpretation mistakes people make (more on that in a moment).
A z score of exactly zero means the value is precisely equal to the mean, neither above nor below. On a normal distribution curve, zero sits right at the peak of the bell, since that's where values cluster most densely.
For example, if two students each score exactly at their own class's average, both get a z score of 0, even if one class averaged 60 points and the other averaged 90. The z score strips away the original scale entirely and just tells you: this value equals the average, full stop.
Z Score vs Standard Deviation vs Percentile
These three terms get used together so often that it's easy to blur them into one concept, but each one measures something different.
| Concept | What It Measures | Example |
|---|---|---|
| Standard Deviation | How spread out an entire data set is | A test with a standard deviation of 10 has more spread in scores than one with a standard deviation of 5 |
| Z Score | How far one specific value sits from the mean, in standard deviation units | A score of 90 on a test with a mean of 75 and a standard deviation of 10 has a z score of 1.5 |
| Percentile | What share of the data a value is higher than | A z score of 1.5 corresponds to roughly the 93rd percentile |
Standard deviation is a property of the whole data set. A z score is a property of one individual value within that data set. A percentile is just another way of expressing that same value's position, translated into a "higher than X% of the group" format that many people find more intuitive than standard deviation units.
Converting between a z score and a percentile requires a standard normal table, often called a z-table, or a calculator, since the relationship follows a specific statistical curve rather than a simple straight-line formula. Our guide on how to interpret a p value in hypothesis testing covers a closely related conversion, since p values in a z-test are calculated directly from a value's z score.
Real-World Uses of Z Scores
Z scores aren't just a classroom exercise. They show up constantly in fields that need a consistent way to flag unusual values.
Standardized Testing and Grading
Test scores are one of the most common places people encounter z scores, even if the report calls it something else, like a "scaled score." When a test is graded on a curve, raw scores often get converted to z scores first, then translated into a final grade or percentile rank, so a "good" score means the same thing regardless of how hard that particular test version happened to be.
Growth Charts in Pediatric Care
Pediatric growth charts use z scores to compare a child's height, weight, and other measurements against a large reference population of children the same age and sex. (CDC) A weight-for-age z score of -2 or lower, for example, is a standard flag that a doctor may look into further, since it means that child's weight sits well below most of their peers.
Quality Control and Six Sigma
Manufacturing and quality control teams use z scores to track how far a product's measurements drift from specification. The "sigma" in Six Sigma literally refers to standard deviations: a Six Sigma process is one where defects sit roughly six standard deviations from the target, making them exceptionally rare.
Finance and Investing
In finance, z scores help identify unusual returns or risk levels by comparing one data point, like a stock's daily return, against its own historical average and volatility. An unusually large z score on a given day can signal an event worth investigating, rather than typical day-to-day noise.
Scientific Research and Hypothesis Testing
Researchers use z scores as the backbone of the z-test, a statistical method for deciding whether an observed result is likely due to chance or reflects a real effect. The z score calculated during a z-test gets converted into a p value, which is what most published research actually reports. Our guide on what a p value really tells you about significance breaks down that connection in more detail, and 100 Calculator's P Value Calculator can help once you're ready to take that next step.
Common Mistakes to Avoid
A z score calculation is simple arithmetic, but a few small missteps can quietly throw off the result or the interpretation. Watch for these:
- Mixing up population and sample standard deviation, which produces slightly different results, especially with small data sets
- Ignoring the sign and treating a z score of -2 the same as +2, when they actually point in opposite directions
- Assuming z scores always translate cleanly into percentiles, when that relationship only holds accurately for roughly normal distributions
- Rounding intermediate steps too early, which can shift the final z score more than expected on borderline values
- Confusing a z score with a percentile and using the two terms interchangeably in a report or analysis
- Using a mean and standard deviation from the wrong reference group, which produces a technically correct but meaningless z score
Most of these are easy to catch with a quick sanity check: does the sign make sense given whether the value is above or below the group's typical range? Does the reference mean and standard deviation actually match the group you're comparing against? A few seconds of double-checking catches the majority of z score errors before they make it into a final report.
Using a Z Score Calculator
Calculating a z score by hand is simple enough for a single value, but it gets tedious fast if you're checking several values against the same data set, or if you'd just rather skip the arithmetic entirely.
100 Calculator's Z Score Calculator takes your raw value, mean, and standard deviation, and instantly returns the z score along with the percentile it corresponds to. It handles both population and sample calculations, so you don't need to remember which version of the formula applies to your situation.
It's especially useful for double-checking a manual calculation, working through multiple values quickly, or converting a z score back into a percentile without pulling up a full z-table. Like every tool on 100 Calculator, it's free to use and doesn't require an account.
Related Calculators
Put what you just read into practice, try these free tools instantly, no sign-up required.
Interval of Convergence Calculator
Find the interval of convergence for any power series.
Mean Absolute Deviation Calculator
Calculate the mean absolute deviation for any data set.
P Value Calculator
Calculate the p-value for your hypothesis test statistic.
Volume of a Sphere Calculator
Calculate the volume of a sphere from its radius or diameter.
Z Score Calculator
Calculate the z-score for a value within a normal distribution.
Sources & References
This guide draws on publicly available statistics references, including:
- National Institutes of Health, National Library of Medicine — an overview of z scores and how they're used in health statistics
- NIST/SEMATECH e-Handbook of Statistical Methods — a public reference maintained by the National Institute of Standards and Technology
- CDC Growth Charts — documentation on how the Centers for Disease Control and Prevention uses z scores in pediatric growth tracking
More From Math & Statistics Guides
Still building your statistics toolkit? These related guides dig deeper into concepts that pair naturally with z scores.
Frequently Asked Questions
What is a z score in simple terms?
A z score tells you how many standard deviations a value is from the average of its data set. A z score of 0 means the value equals the average. Positive numbers mean above average, negative numbers mean below average. It's a way to describe exactly how unusual or typical a single number is, once you know the average and spread of the group it came from.
What is the formula for calculating a z score?
The z score formula is z = (x − μ) / σ, where x is the value you're checking, μ (mu) is the mean of the data set, and σ (sigma) is the standard deviation. Subtract the mean from your value, then divide that result by the standard deviation. For sample data, the same formula works using the sample mean and sample standard deviation in place of μ and σ.
How do you calculate a z score by hand?
Start by finding the mean and standard deviation of your data set, if you don't already have them. Subtract the mean from the value you're checking. Then divide that difference by the standard deviation. The result is your z score. For example, if a test has a mean of 75 and a standard deviation of 10, a score of 90 gives you (90 − 75) / 10, which works out to a z score of 1.5.
What does a z score of 0 mean?
A z score of 0 means the value is exactly equal to the mean of its data set. It's neither above nor below average. On a normal distribution curve, a z score of 0 sits right at the center, the highest point of the bell curve, since that's where the most common values cluster.
What does a negative z score mean?
A negative z score means the value falls below the average of its data set. The more negative the number, the further below average that value sits. A z score of -1 means the value is one standard deviation below the mean, while -2.5 means it's two and a half standard deviations below average, which is fairly unusual in most normally distributed data.
What is considered a normal or typical z score?
Z scores between -1 and +1 are generally considered typical, since about 68% of values in a normal distribution fall in that range. Scores between -2 and +2 cover about 95% of the data, so anything past ±2 starts to stand out, and anything past ±3 is rare enough that it's often flagged as a possible outlier.
What z score is considered an outlier?
There's no single official cutoff, but a common rule of thumb treats z scores beyond +3 or -3 as potential outliers, since less than 0.3% of values in a normal distribution fall out that far. Some fields use a stricter threshold of ±2.5. Whether a value truly counts as an outlier also depends on context, sample size, and whether the data is normally distributed in the first place.
How is a z score different from a percentile?
A z score tells you how many standard deviations a value is from the mean, while a percentile tells you what share of the data that value is higher than. The two are connected: for normally distributed data, a specific z score always corresponds to a specific percentile. A z score of 0 corresponds to the 50th percentile, and a z score of 1 corresponds to roughly the 84th percentile.
How is a z score different from standard deviation?
Standard deviation describes how spread out an entire data set is, using one single number. A z score describes where one individual value falls within that spread, measured in standard deviation units. Think of standard deviation as the ruler, and the z score as the specific measurement you take with that ruler for a single data point.
Can you calculate a z score without knowing the standard deviation?
No. The standard deviation is a required part of the z score formula, since it's what the difference between your value and the mean gets divided by. If you don't know the standard deviation, you'll need to calculate it first from the raw data, or use the sample standard deviation if you're working with a sample rather than a full population.
What is the difference between a z score and a T score?
A z score is based on a scale with a mean of 0 and a standard deviation of 1, which means it often includes negative numbers and decimals. A T score rescales that same information onto a scale with a mean of 50 and a standard deviation of 10, mainly to avoid negative numbers in reports like psychological test results. The formula is T = 50 + 10z.
What is the 68-95-99.7 rule?
The 68-95-99.7 rule, also called the empirical rule, describes how data spreads out in a normal distribution. About 68% of values fall within 1 standard deviation of the mean, 95% fall within 2 standard deviations, and 99.7% fall within 3 standard deviations. It's a quick way to gauge how common or unusual a given z score is without looking up an exact percentile.
Do z scores work for data that isn't normally distributed?
You can calculate a z score for any numeric data set, since the formula only needs a mean and standard deviation. But the percentile interpretations tied to the empirical rule and the standard normal table only hold up accurately when the underlying data follows a roughly normal, bell-shaped distribution. For skewed data, the z score still shows relative position, but the percentage estimates become less reliable.
What is a z score used for in real life?
Z scores show up in standardized test reporting, pediatric growth charts that track a child's height and weight against peers, quality control processes like Six Sigma that flag defects, finance for spotting unusual returns, and research for hypothesis testing. Anywhere someone needs to compare a single value against a group average in a consistent, standardized way, a z score is a natural fit.
How do you convert a z score to a percentile?
You look up the z score in a standard normal distribution table, often called a z-table, which lists the percentage of data falling below each z score value. Many calculators and spreadsheet functions do this conversion automatically. A z score of 1.0, for example, corresponds to approximately the 84th percentile, meaning about 84% of values fall below it.
About 100 Calculator
100 Calculator is a free hub of online calculators and educational guides covering health, finance, trading, crypto, education, math, and more. Every tool is built to be fast, accurate, and genuinely free, with no account or signup required.
We built this guide, and the Z Score Calculator referenced throughout it, to make statistics concepts easier to work through without pulling out a textbook. Head back to the 100 Calculator homepage to explore the full library of tools, or learn more about the team behind them on our About Us page.