How to Interpret a P Value in Hypothesis Testing
A plain-language walkthrough of what a p-value actually measures, how to compare it to your significance level, and the misreadings that trip up even careful researchers.
You ran the test, and now you're staring at a single number: the p-value. It's easy to treat it like a verdict, proof that your idea is right or wrong, but that's not what it measures. Misreading that one number is one of the most common mistakes in statistics, showing up in student papers, published research, and business A/B tests alike.
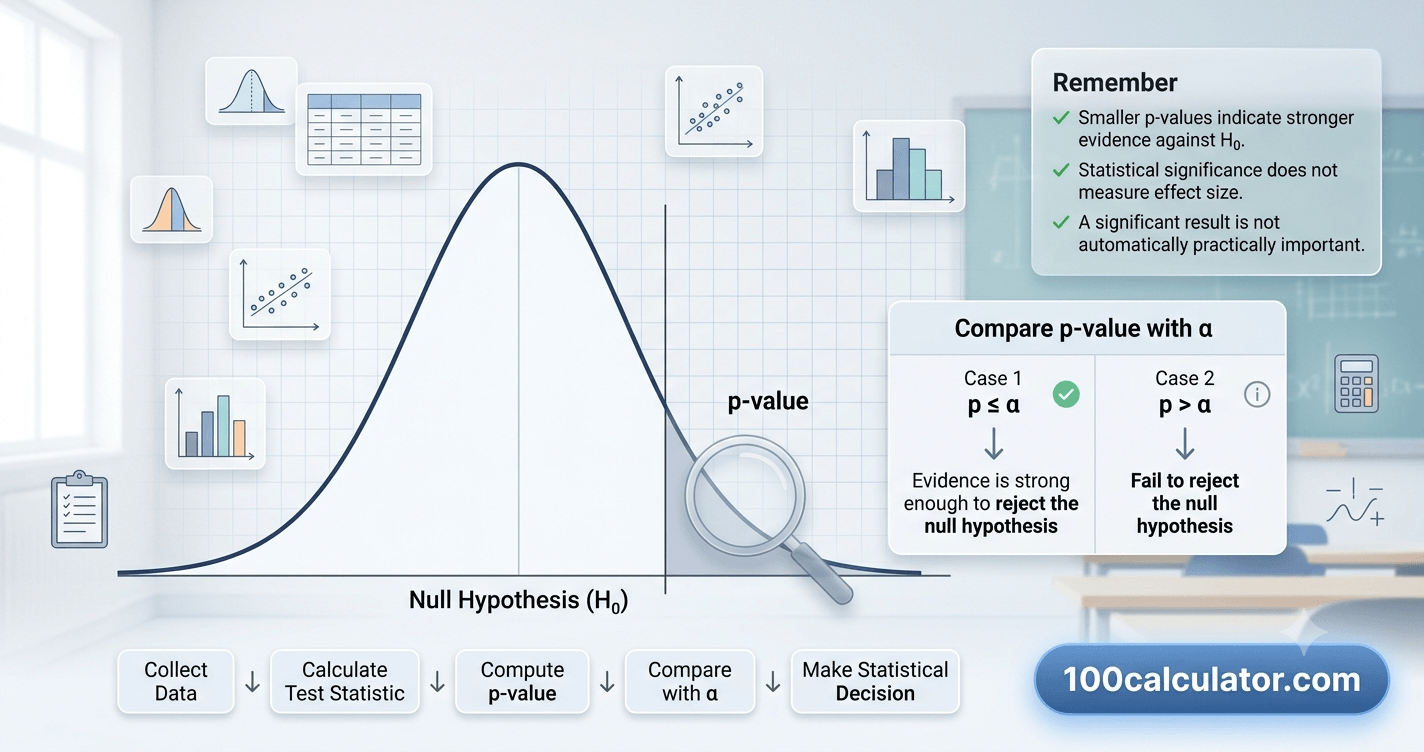
A p-value is the probability of getting a result at least as extreme as the one you observed, assuming the null hypothesis is true. It does not tell you the probability that your hypothesis is correct, and it does not measure how large or important your effect is. A small p-value means your data would look unusual if there were truly no effect. A large p-value means your data fits comfortably with that "no effect" assumption.
In short: compare your p-value to a significance level you picked before running the test, usually 0.05. If p is less than or equal to that level, you reject the null hypothesis. If it's higher, you fail to reject it. That comparison, and what it does and doesn't prove, is what the rest of this guide walks through.
We'll start with the basics of hypothesis testing, work through exactly how to read a p-value, look at real worked examples, and cover the misconceptions that trip up even careful researchers. If you just need the number itself, 100 Calculator's P Value Calculator can compute it directly from your test statistic.
Hypothesis Testing Basics
Before a p-value means anything, you need the framework it lives inside: hypothesis testing. It's a structured way of asking "does this pattern in my data reflect something real, or could it just be random noise?"
The Null and Alternative Hypothesis
Every hypothesis test starts with two competing statements. The null hypothesis (H₀) usually claims there's no effect or no difference, like "this new teaching method performs the same as the old one." The alternative hypothesis (H₁ or Hₐ) is what you're actually trying to find support for, such as "this new teaching method performs differently."
A hypothesis test never sets out to prove the alternative hypothesis directly. Instead, it looks for evidence against the null hypothesis. If that evidence is strong enough, you reject the null hypothesis in favor of the alternative.
The Significance Level (Alpha)
The significance level, written as α (alpha), is the threshold you set before collecting or analyzing data. It represents how much risk of a false positive you're willing to accept. An alpha of 0.05 means you're accepting up to a 5% chance of rejecting a true null hypothesis by mistake.
Choosing alpha ahead of time matters. If you pick your threshold after seeing the results, you can quietly bend your standard of evidence to match whatever you already hoped to find.
What a Test Statistic Does
A test statistic is a single number, like a z-score or t-score, that summarizes how far your sample data sits from what the null hypothesis predicts. Our guide to z-scores covers this calculation in more depth. The p-value is derived directly from this test statistic: the further it sits from what the null hypothesis expects, the smaller the resulting p-value tends to be.
What Is a P-Value?
With the basics in place, here's the precise idea behind the number itself.
The Formal Definition
A p-value is the probability of observing a test statistic as extreme as, or more extreme than, the one calculated from your sample, assuming the null hypothesis is true. It answers one specific question: "if there were truly no effect, how likely would data like mine be?"
A small p-value means your data would be surprising under that "no effect" assumption, which counts as evidence against the null hypothesis. A large p-value means your data is exactly the kind of thing you'd expect to see even if nothing were going on.
What a P-Value Is Not
A p-value is not the probability that the null hypothesis is true. It's not the probability that your results happened "by chance" in some general sense, and it's not a measure of how big or important your effect is. It also isn't the probability that you'd get the same result if you repeated the study. Each of these is a separate, common misreading, and we'll unpack them further in the myths and facts section below.
How to Interpret a P-Value Step by Step
Interpreting a p-value correctly comes down to a short, repeatable process. Here's how to work through it every time:
- State your hypotheses first. Write down the null and alternative hypothesis before you look at any results.
- Choose your significance level in advance. Decide on alpha, commonly 0.05, before running the analysis.
- Calculate your test statistic and p-value. Use your test's formula, statistical software, or a p value calculator to get the exact figure.
- Compare the p-value to alpha. This single comparison drives your decision.
- State your conclusion in plain language, tied back to your original question, not just "reject" or "fail to reject."
Decision Rule
If p ≤ α → Reject the null hypothesis Result is statistically significant If p > α → Fail to reject the null hypothesis Result is not statistically significant
p = the p-value from your test
α = your chosen significance level (commonly 0.05)
| P-Value | Compared to α = 0.05 | Decision |
|---|---|---|
| p = 0.002 | p < 0.05 | Reject H₀ — statistically significant |
| p = 0.04 | p < 0.05 | Reject H₀ — statistically significant |
| p = 0.08 | p > 0.05 | Fail to reject H₀ — not statistically significant |
| p = 0.50 | p > 0.05 | Fail to reject H₀ — not statistically significant |
Free Online Tool
Skip the statistical tables
100 Calculator's P Value Calculator converts a test statistic straight into a p-value, for one-tailed or two-tailed tests, without needing to look anything up by hand.
P-Value Examples in Practice
The decision rule is simple to state but easier to trust once you've seen it applied. These three illustrative examples walk through the same logic in different settings.
Example: Testing a New Medication
Imagine a researcher wants to know whether a new pain medication reduces pain more than a placebo. The null hypothesis states there's no difference in average pain reduction between the drug and placebo groups. After running the trial, the calculated p-value comes out to 0.03. Since 0.03 is less than the standard alpha of 0.05, the researcher rejects the null hypothesis and concludes the drug's effect was statistically significant compared to the placebo.
Example: A/B Testing a Website Change
A company wants to know if changing a checkout button from blue to green increases how often people click it. The null hypothesis says there's no difference in click-through rate between the two colors. The A/B test returns a p-value of 0.22. Since 0.22 is greater than 0.05, the team fails to reject the null hypothesis. The color change didn't produce a statistically significant difference in clicks, at least not one this test could detect.
Example: Comparing Two Teaching Methods
A teacher compares average quiz scores between two classes using different review methods: flashcards versus practice tests. The null hypothesis is that there's no difference in average scores between the two methods. The calculated p-value is 0.048. Using the standard 0.05 threshold, the teacher narrowly rejects the null hypothesis, but a result sitting this close to the cutoff is worth treating cautiously rather than as settled proof, ideally by repeating the comparison with another group before drawing a firm conclusion.
One-Tailed vs Two-Tailed P-Values
Not every p-value is calculated the same way. Whether your test looks in one direction or both changes how the p-value is measured, and mixing the two up is a common source of confusion.
A one-tailed test looks for an effect in one specific direction only, like "this method is better than the old one." The entire rejection region sits in a single tail of the distribution. A two-tailed test looks for a difference in either direction, better or worse, so the rejection region is split between both tails. Unless you have a clear, justified reason to expect an effect in only one direction, a two-tailed test is the more conservative and more common default.
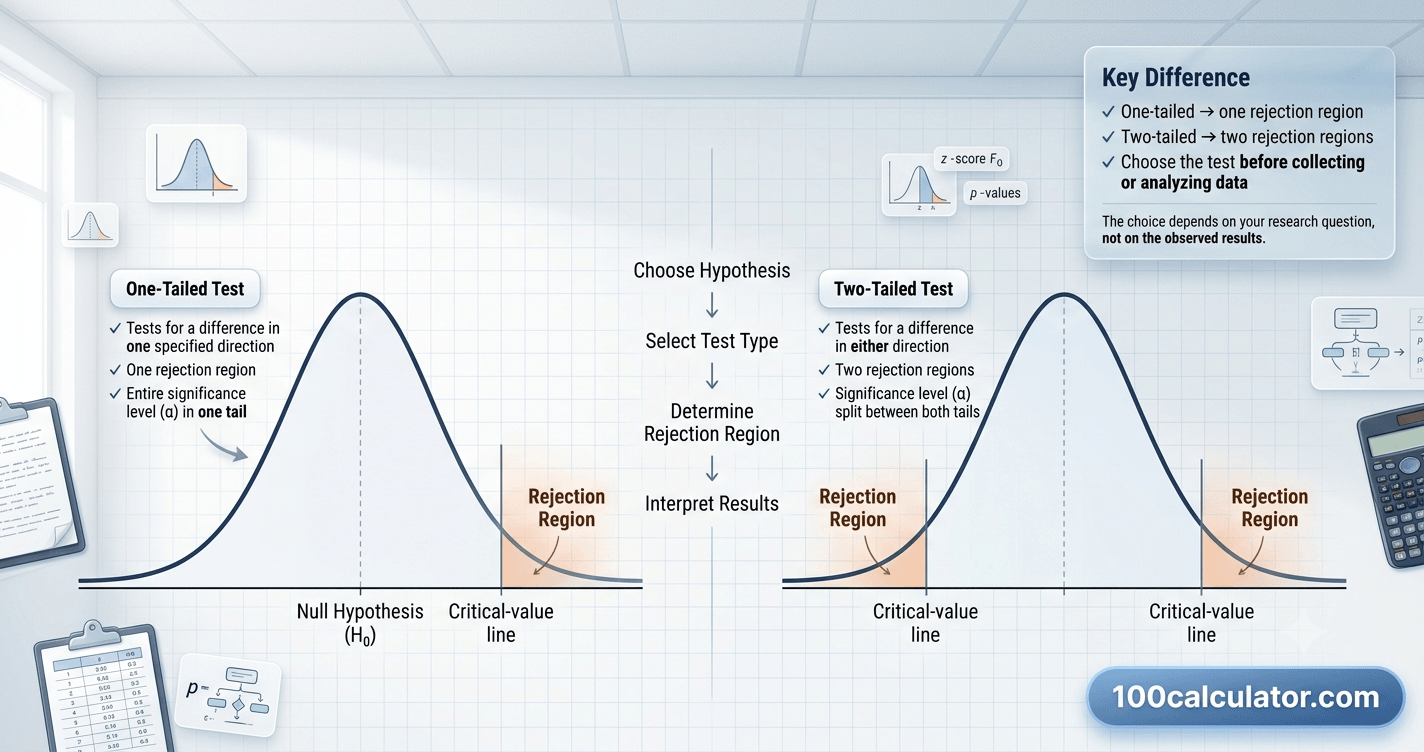
| Feature | One-Tailed Test | Two-Tailed Test |
|---|---|---|
| Tests for | An effect in one specific direction | An effect in either direction |
| Rejection region | One tail of the distribution | Both tails, split evenly |
| P-value calculation | Area in one tail only | Combined area in both tails |
| Best used when | Direction is clearly specified in advance | Direction of the effect is uncertain |
Common P-Value Myths vs Facts
The p-value is one of the most misunderstood numbers in statistics. Even researchers who use it every day fall into a handful of the same recurring traps. Here are the ones worth correcting first.
Myth
A p-value tells you the probability that the null hypothesis is true.
Fact
A p-value assumes the null hypothesis is true and asks how likely your data would be under that assumption. It says nothing about the probability that the null hypothesis itself is correct.
Myth
A p-value of 0.05 means there's a 95% chance your result is real.
Fact
The p-value doesn't measure the probability that a finding is real or reproducible. It only measures how surprising your data would be if there were truly no effect at all.
Myth
A smaller p-value always means a larger, more important effect.
Fact
A tiny p-value can come from a trivial effect if the sample size is large enough. Statistical significance and practical significance are two different questions.
Myth
A p-value above 0.05 proves the null hypothesis is true.
Fact
Failing to reject the null hypothesis isn't the same as proving it. It may simply mean the study lacked the power to detect a real effect.
Myth
P-values from different studies can be compared directly to see whose result is "more significant."
Fact
P-values depend on sample size, variability, and the specific test used, so comparing raw p-values across different studies can be misleading on its own.
What Affects the Size of a P-Value
A p-value isn't a fixed property of an effect. It shifts based on a few specific factors in your study design and data.
Sample Size
Larger samples tend to produce smaller p-values for the same underlying effect, because more data reduces random sampling noise. This is exactly why a huge study can turn a practically meaningless difference into a "statistically significant" one.
Effect Size
Bigger real differences between groups tend to produce smaller p-values, all else being equal. A drug that cuts recovery time in half will generally show a smaller p-value than one that shaves off a single day, given the same sample size.
Variability in the Data
More spread or noise in your data makes it harder to distinguish a real signal from random fluctuation, which tends to push p-values higher. Our guide on calculating mean absolute deviation walks through one common way to measure exactly how spread out a data set is.
Choosing a Significance Level
0.05 is the most widely used significance level across many fields, but it's a convention, not a law of nature. The right threshold depends on how costly a false positive would be in your specific situation.
| Significance Level (α) | Typical Use Case |
|---|---|
| 0.10 | Exploratory research and early-stage studies |
| 0.05 | The most common standard across many fields |
| 0.01 | Fields where a false positive is especially costly |
| 0.001 | High-stakes research requiring very strong evidence |
Whatever threshold you land on, choose it before you look at your results, and stay consistent with it for the duration of the analysis.
Why a P-Value Alone Isn't Enough
A p-value answers a narrow question: how surprising is this data under the null hypothesis? It was never designed to carry the full weight of a research conclusion by itself.
Statistical vs Practical Significance
A result can be statistically significant without being practically meaningful. A weight-loss program that produces a statistically significant but average half-pound difference over a year isn't likely to matter to anyone using it. The American Statistical Association has stated plainly that a small p-value on its own doesn't indicate how large or meaningful an effect actually is, which is exactly why effect size and confidence intervals deserve equal billing alongside the p-value.
The Multiple Comparisons Problem
Running many statistical tests raises the odds of a false positive turning up purely by chance, even if nothing real is happening in any of them. If you run 20 independent tests at α = 0.05, the chance that at least one comes back "significant" by chance alone climbs to roughly 64%. Testing many variables and only reporting the ones that happened to clear 0.05 is a well-known way studies end up reporting false positives.
Before trusting a p-value on its own, it helps to ask:
- Was the significance level chosen before looking at the results?
- Is the effect size large enough to matter in practice, not just statistically?
- Were multiple comparisons or variables tested along the way?
- Is the sample size reasonable for the claim being made?
Common Mistakes When Interpreting P-Values
Beyond the myths above, a handful of habits quietly undermine otherwise solid analysis:
- Choosing alpha after seeing the data. Setting your threshold once you already know the result defeats its purpose as a standard of evidence.
- Treating p = 0.049 and p = 0.051 as fundamentally different. Both values reflect very similar evidence; a strict cutoff shouldn't be read as a meaningful gap between them.
- Ignoring effect size and confidence intervals. A p-value alone can't tell you how large or how precise an effect is.
- Running many tests and reporting only the significant one. This inflates your real false-positive rate far above your stated significance level.
- Stopping data collection as soon as results look significant. Peeking at results repeatedly and stopping early biases the p-value toward appearing more significant than it is.
- Skipping the test's underlying assumptions. Many common tests assume things like a roughly normal distribution; violating those assumptions can make the resulting p-value unreliable.
Related Calculators
Put what you just read into practice, try these free tools instantly, no sign-up required.
Interval of Convergence Calculator
Find the interval of convergence for any power series.
Mean Absolute Deviation Calculator
Calculate the mean absolute deviation for any data set.
P Value Calculator
Calculate the p-value for your hypothesis test statistic.
Volume of a Sphere Calculator
Calculate the volume of a sphere from its radius or diameter.
Z Score Calculator
Calculate the z-score for a value within a normal distribution.
Using a P-Value Calculator
Calculating a p-value by hand means finding your test statistic, then looking up how much of the relevant distribution falls beyond it using a printed statistical table. It works, but it's slow, and it's easy to misread a table or grab the wrong row for your degrees of freedom.
A p value calculator does the same lookup instantly. Enter your test statistic, choose your test type, and specify whether it's one-tailed or two-tailed, and it returns the exact p-value without any manual table lookups. 100 Calculator's P Value Calculator handles this directly in your browser, with no signup required.
If your analysis also involves standardizing a score or comparing values across different scales, the Z Score Calculator and the Mean Absolute Deviation Calculator cover two of the most common supporting calculations you'll need alongside a p-value.
More From Math & Statistics
Still building your statistics toolkit? These related guides dig deeper into the concepts that pair naturally with p-values and hypothesis testing.
Sources & References
This guide draws on how p-values and hypothesis testing are explained in these official statistics resources:
- American Statistical Association — The ASA's Statement on p-Values: Context, Process, and Purpose, Wasserstein & Lazar, 2016. Read the statement
- NIST/SEMATECH — e-Handbook of Statistical Methods, section 7.1.3.1, Critical Values and P-Values. Read the handbook section
Frequently Asked Questions
What is a p-value in simple terms?
A p-value is the probability of getting a result at least as extreme as what you observed, assuming the null hypothesis is true. It doesn't tell you whether your hypothesis is correct. It only tells you how surprising your data would look if there were truly no effect or difference. A small p-value means your data would be unusual under that assumption; a large one means your data fits comfortably with it.
What does it mean if the p-value is less than 0.05?
A p-value below 0.05, the most common significance level, means your result would happen less than 5% of the time if the null hypothesis were actually true. Researchers typically treat this as strong enough evidence to reject the null hypothesis and call the result statistically significant. It doesn't guarantee the effect is real or important, just that it's unlikely to be pure chance at that threshold.
What does it mean if the p-value is greater than 0.05?
A p-value above 0.05 means your data isn't surprising enough under the null hypothesis to reject it. Statisticians describe this as "failing to reject the null hypothesis," rather than proving it true. It might mean there's genuinely no effect, or it might mean your sample was too small or too noisy to detect a real one.
Does a low p-value mean the null hypothesis is false?
Not exactly. A low p-value means your observed data would be unlikely if the null hypothesis were true, which counts as evidence against it, but isn't absolute proof. There's always a small chance you're looking at a false positive, especially if you ran multiple tests or used a small sample. A low p-value supports rejecting the null hypothesis; it doesn't guarantee it's false.
Does a high p-value prove the null hypothesis is true?
No. A high p-value only means you don't have enough evidence to reject the null hypothesis, which is different from proving it's correct. Your test might have lacked the statistical power to detect a real effect, especially with a small sample size. Absence of evidence against the null hypothesis isn't the same as evidence that it's true.
What is the difference between a p-value and a significance level?
The significance level, or alpha, is a threshold you choose before running your test, commonly 0.05. The p-value is the result you calculate after analyzing your data. You compare the two: if the p-value is less than or equal to alpha, you reject the null hypothesis. Alpha is your standard for evidence; the p-value is the evidence itself.
Can a p-value be negative or greater than 1?
No. A p-value is a probability, so it always falls between 0 and 1. A p-value of 0 would mean your result is essentially impossible under the null hypothesis, and a p-value of 1 would mean your result is exactly what you'd expect if the null hypothesis were true. If a calculation produces a number outside that range, something in the math or test setup is wrong.
What is the difference between one-tailed and two-tailed p-values?
A one-tailed p-value tests for an effect in one specific direction, like whether a new method is better than an old one. A two-tailed p-value tests for a difference in either direction, whether better or worse. Two-tailed tests are more conservative and are the more common default unless you have a clear reason to expect the effect only one way.
Does a smaller p-value always mean a bigger effect?
No, and this is one of the most common mix-ups. A p-value reflects how unlikely your result is under the null hypothesis, which depends heavily on sample size, not just the size of the effect. A tiny, practically meaningless difference can produce a very small p-value if the sample is large enough. Always look at the effect size alongside the p-value.
What is a Type I error in relation to p-values?
A Type I error happens when you reject a null hypothesis that's actually true, essentially a false positive. Your significance level, alpha, sets the maximum rate you're willing to accept for this kind of error. If you use alpha equal to 0.05, you're accepting up to a 5% chance of a Type I error on any single test.
What is p-hacking?
P-hacking refers to analyzing data in ways that push a p-value below 0.05, often by testing many variables, trying different statistical methods, or stopping data collection as soon as a significant result appears. It inflates the chance of a false positive well beyond the stated significance level. Deciding on your hypothesis and analysis plan before collecting data helps guard against it.
How do I calculate a p-value by hand?
Calculating a p-value by hand involves finding your test statistic, like a z-score or t-score, then looking up how much of the relevant probability distribution falls beyond that value using a statistical table. It's doable for simple z-tests but gets tedious and error-prone for more complex tests. A p value calculator does the same lookup instantly and reduces the chance of a rounding or table-reading mistake.
What's a good p-value threshold to use?
0.05 is the most widely used significance level across many fields, but it's a convention, not a universal rule. Fields where false positives carry serious consequences sometimes use stricter thresholds, like 0.01 or lower. Exploratory research sometimes uses a looser 0.10. Choose your threshold before analyzing your data, based on how costly a false positive would be.
Can two studies with different p-values both be correct?
Yes. P-values depend on sample size, variability, and the specific effect being measured, so two well-designed studies can report different p-values for related but not identical questions. A larger, more precise study might report a smaller p-value for the same real effect simply because it has more statistical power, not because the smaller study was wrong.
Is a p-value of exactly 0.05 significant or not?
By the strict convention of alpha equal to 0.05, a p-value of exactly 0.05 is usually treated as just barely reaching significance, since most tests use "p ≤ 0.05" as the cutoff. In practice, a result sitting right at the boundary deserves caution rather than a confident conclusion either way. Many researchers would want to see the finding replicated before treating it as solid evidence.
Why do statisticians say "fail to reject" instead of "accept" the null hypothesis?
Hypothesis testing is built around looking for evidence against the null hypothesis, not proving it correct. "Failing to reject" reflects that your data simply didn't provide strong enough evidence to rule it out, which is different from confirming it's true. This wording keeps the door open to the possibility that a bigger or better-designed study might still find a real effect.
About 100 Calculator
100 Calculator is a free hub of online calculators and educational guides covering health, finance, trading, crypto, education, math, and more. Every tool is built to be fast, accurate, and genuinely free, with no account or signup required.
We built this guide, and tools like the P Value Calculator referenced throughout it, to make everyday statistics questions a little easier to work through. Head back to the 100 Calculator homepage to explore the full library of tools, or learn more about the team behind them on our About Us page.