Mean Absolute Deviation vs Standard Deviation Explained
Both measures describe how spread out your data is, but they get there through different math. Here's a clear, beginner-friendly comparison with formulas, a worked example, and guidance on which one to reach for.
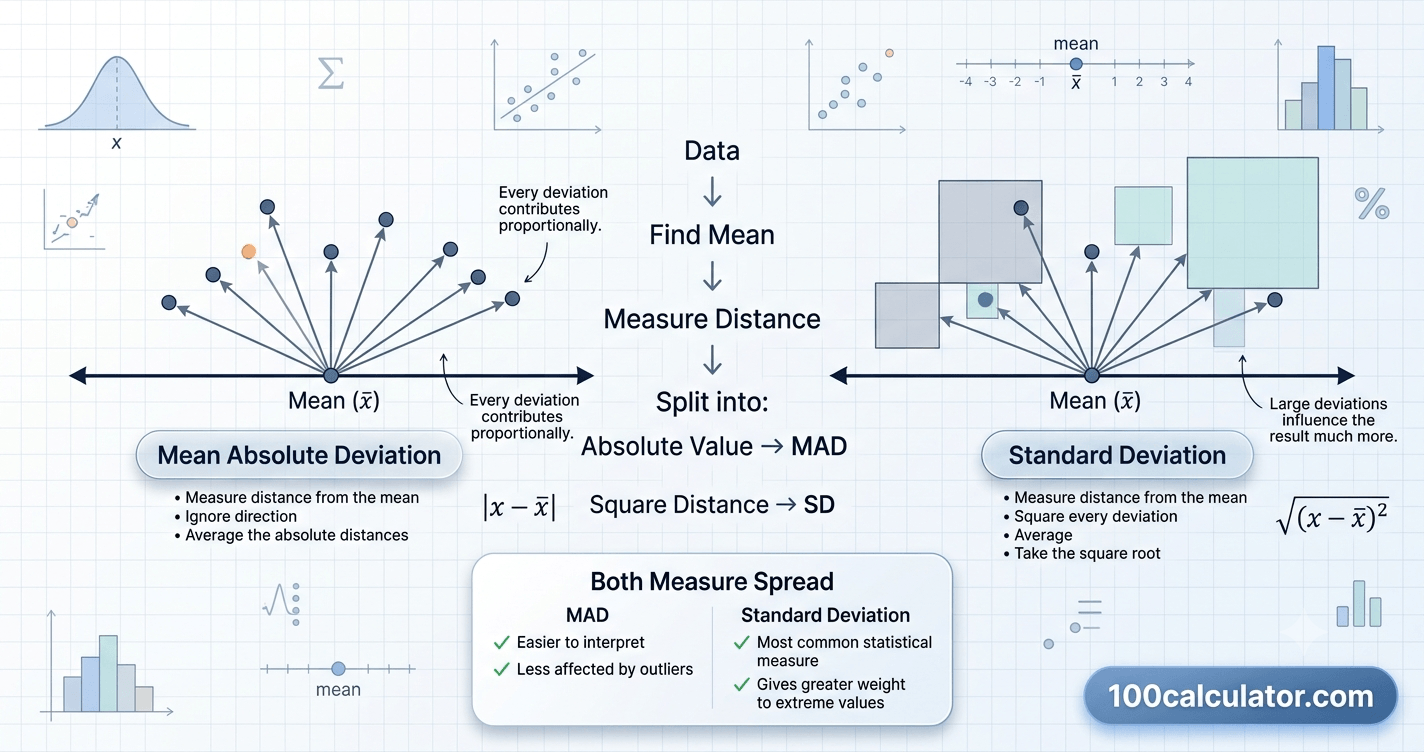
Ask two people to describe how spread out a set of numbers is, and you can get two different, equally valid answers. Mean absolute deviation and standard deviation are the two most common ways statisticians answer that question, and while they're both measuring the same basic idea, they get there through different math and behave differently once your data gets messy.
Mean absolute deviation (MAD) is the average distance between each data point and the mean, ignoring whether that distance is positive or negative. Standard deviation measures the same basic idea but squares each distance before averaging, then takes the square root, which gives extra weight to values that sit farther from the mean. That one difference in approach — absolute value versus squaring — is the root of nearly every other difference between the two measures.
In this guide, we'll walk through both formulas using the same worked example, show exactly how outliers affect each measure differently, and help you decide which one fits your situation. If you just need a fast answer for your own numbers, 100 Calculator's Mean Absolute Deviation Calculator handles the math the moment you enter your data.
Before comparing the two, it helps to understand what "spread" and "deviation" actually mean in statistics, since that's the foundation both formulas are built on.
What Do "Spread" and "Deviation" Actually Mean?
In statistics, the mean tells you where the center of your data sits, but it doesn't tell you how the individual values are arranged around that center. Two data sets can share the exact same mean and still look completely different once you actually look at the numbers.
Why the Mean Alone Doesn't Tell the Whole Story
Picture two classes that both average 75% on a test. In one class, almost every student scored between 70 and 80. In the other, half the class scored in the 50s and the other half scored in the 90s. The mean is identical, but the two classes tell very different stories. Measures of spread, sometimes called measures of dispersion or variability, are built to capture that difference.
What "Deviation From the Mean" Means
A deviation is simply the distance between one data point and the mean, found by subtracting the mean from that value. A point above the mean has a positive deviation, and a point below the mean has a negative deviation. If you add up every raw deviation in a data set, the positives and negatives always cancel out to zero, which is exactly why mean absolute deviation and standard deviation each need their own trick — absolute value or squaring — to stop that cancellation from happening.
What Is Mean Absolute Deviation (MAD)?
Mean absolute deviation is often the first measure of spread taught in introductory statistics, precisely because it's the most intuitive one. It answers a simple question: on average, how far is each data point from the mean?
The Mean Absolute Deviation Formula
To stop positive and negative deviations from canceling each other out, MAD takes the absolute value of each deviation before averaging. The formula looks like this:
Mean Absolute Deviation Formula
MAD = Σ|x − x̄| ÷ n
x — each individual value in the data set
x̄ (x-bar) — the mean of the data set
n — the total number of values
Σ — "sum of," meaning add up the result for every value
| | — absolute value, which drops any negative sign
How to Calculate Mean Absolute Deviation Step by Step
Let's work through the data set from the chart above: 2, 4, 4, 4, 5, 5, 7, 9. If you'd rather see this broken down in even more detail, our step-by-step guide to calculating mean absolute deviation walks through additional examples.
- Find the mean. Add the eight values (2+4+4+4+5+5+7+9 = 40) and divide by 8, which gives a mean of 5.
- Subtract the mean from each value. That gives you: −3, −1, −1, −1, 0, 0, +2, +4.
- Take the absolute value of each result. The negative signs disappear: 3, 1, 1, 1, 0, 0, 2, 4.
- Add up the absolute deviations. 3+1+1+1+0+0+2+4 = 12.
- Divide by the number of values. 12 ÷ 8 = 1.5.
The mean absolute deviation of this data set is 1.5. On average, each value sits 1.5 units away from the mean of 5.
| Value (x) | Deviation (x − mean) | Absolute Deviation |
|---|---|---|
| 2 | −3 | 3 |
| 4 | −1 | 1 |
| 4 | −1 | 1 |
| 4 | −1 | 1 |
| 5 | 0 | 0 |
| 5 | 0 | 0 |
| 7 | +2 | 2 |
| 9 | +4 | 4 |
| Total | 0 | 12 |
Notice that the raw deviations always add up to zero, no matter what the data looks like. That's exactly why the absolute value step in row three is necessary — it keeps the negative and positive distances from canceling each other out before you average them.
What Is Standard Deviation?
Standard deviation measures the same underlying idea as mean absolute deviation — the average distance from the mean — but it gets there through squaring instead of absolute value. That single change is what makes standard deviation behave so differently in practice.
The Standard Deviation Formula
Instead of taking the absolute value of each deviation, standard deviation squares it, which also removes the negative sign since a squared number is always positive or zero. After averaging the squared deviations, a final square root step brings the result back into the original units of your data:
Standard Deviation Formula (Population)
σ = √[Σ(x − x̄)² ÷ n]
σ (sigma) — the population standard deviation
x — each individual value in the data set
x̄ (x-bar) — the mean of the data set
n — the total number of values in the population
Σ( )² — square each deviation, then add all the squared results together
Population vs Sample Standard Deviation
The formula above works when your data represents an entire population — every value you care about. Most of the time in real life, though, you're working with a sample meant to represent a larger group, and in that case the formula changes slightly: you divide by n − 1 instead of n. This adjustment is called Bessel's correction, and it exists because a sample tends to slightly underestimate the true spread of the full population, so dividing by a smaller number nudges the result upward to correct for that bias.
| Situation | Divide By | Symbol |
|---|---|---|
| You have data for every member of the group you're studying | n | σ (sigma) |
| You have a sample meant to represent a larger population | n − 1 | s |
A Worked Example of Standard Deviation
Let's use the same data set as before — 2, 4, 4, 4, 5, 5, 7, 9 — treated as a full population, so we'll divide by n.
| Value (x) | Deviation (x − mean) | Squared Deviation |
|---|---|---|
| 2 | −3 | 9 |
| 4 | −1 | 1 |
| 4 | −1 | 1 |
| 4 | −1 | 1 |
| 5 | 0 | 0 |
| 5 | 0 | 0 |
| 7 | +2 | 4 |
| 9 | +4 | 16 |
| Total | 0 | 32 |
Dividing the total squared deviation by n gives you the variance: 32 ÷ 8 = 4. Taking the square root of 4 gives a population standard deviation of 2. Compare that to the mean absolute deviation we calculated earlier — 1.5 — using the exact same data. If this had been a sample instead of a full population, you'd divide 32 by 7 (n − 1) instead of 8, giving a variance of about 4.57 and a sample standard deviation of approximately 2.14.
Mean Absolute Deviation vs Standard Deviation: The Key Differences
Now that you've seen both formulas in action on the same data, let's break down exactly why they produce different results and what that means in practice.
Absolute Values vs Squared Values
This is the fundamental difference. MAD treats a distance of 4 units and a distance of 2 units as literally twice as far apart — nothing more, nothing less. Standard deviation squares those same distances first (16 versus 4), which means a point twice as far from the mean contributes four times as much to the total. That single design choice changes how each measure responds to unusually large or small values.
How Each Measure Treats Outliers
Let's see this play out with two small data sets that are identical except for one value. Data set A is 2, 4, 6, 8, 10. Data set B swaps that last 10 for a 50, turning it into an outlier: 2, 4, 6, 8, 50.
| Data Set | Mean | Mean Absolute Deviation | Population Standard Deviation |
|---|---|---|---|
| A: 2, 4, 6, 8, 10 | 6 | 2.4 | ≈ 2.83 |
| B: 2, 4, 6, 8, 50 | 14 | 14.4 | ≈ 18.11 |
Both measures increase once the outlier is introduced, which makes sense since the data really is more spread out. But look at how much of each total comes from the outlier itself. In data set B, the value 50 accounts for 36 of the 72 total absolute deviation (exactly 50%), but it accounts for 1,296 of the 1,640 total squared deviation — nearly 79%. Squaring hands that single unusual value a much bigger share of the final result, which is exactly why standard deviation is considered far more sensitive to outliers than mean absolute deviation.
Units and Interpretation
Both measures end up in the same units as your original data, which makes them directly comparable to the values you started with. Mean absolute deviation never leaves those units, since it only ever adds and averages. Standard deviation technically leaves the original units behind during the squaring step, which is why the final square root is essential — without it, you'd be left with variance, a number in squared units that's much harder to interpret on its own.
| Feature | Mean Absolute Deviation | Standard Deviation |
|---|---|---|
| Based on | Absolute value of each deviation | Squared value of each deviation, then a square root |
| Sensitivity to outliers | Lower — every unit of distance counts equally | Higher — larger distances count disproportionately more |
| Typical value | Usually the smaller of the two | Mathematically always ≥ mean absolute deviation |
| Units | Same as the original data | Same as the original data, after the square root |
| Connects to | Mean absolute error in forecasting | Variance, z-scores, the normal distribution |
| Ease of calculation by hand | Simple — sums of absolute values | Slightly more involved — squaring and a square root |
When Should You Use Mean Absolute Deviation vs Standard Deviation?
Neither measure is "better" in an absolute sense — they're suited to different situations. Here's a practical way to decide which one fits what you're working on.
Simpler & More Intuitive
Choose Mean Absolute Deviation When…
- You want a spread measure that's easy to explain to a non-technical audience
- You're just learning statistics and want an intuitive first measure of spread
- Your data includes outliers you don't want dominating the result
- You're evaluating forecast accuracy, where mean absolute error follows the same logic
- You want every unit of distance from the mean to count equally
The Statistical Standard
Choose Standard Deviation When…
- Your data is roughly normally distributed
- You need z-scores, confidence intervals, or a hypothesis test
- You're comparing variability across data sets using standard statistical methods
- Your field — finance, science, engineering — expects standard deviation by convention
- You'll use the result in further calculations that build on variance
If you're still unsure, standard deviation is the safer default for formal or academic work, simply because it's what most statistical tools, courses, and research papers expect. Mean absolute deviation is a great choice when clarity matters more than convention — for a classroom explanation, a simple report, or any time outliers might unfairly skew your result.
Why Standard Deviation Is the Default in Most Statistics
If mean absolute deviation is simpler to calculate and easier to explain, it's fair to wonder why standard deviation became the standard measure taught in most statistics courses and used in most research. The answer comes down to how well standard deviation connects to other statistical tools.
The Empirical Rule and the Normal Distribution
For data that follows, or roughly follows, a normal distribution — the classic bell curve — standard deviation unlocks a set of predictable percentages known as the empirical rule, or the 68-95-99.7 rule. About 68% of values fall within one standard deviation of the mean, about 95% fall within two standard deviations, and about 99.7% fall within three. Mean absolute deviation doesn't have an equivalent relationship to the normal distribution, which is a major reason standard deviation is preferred whenever a data set is expected to be roughly bell-shaped.
Standard Deviation's Connection to Z-Scores and Variance
Standard deviation is the square root of variance, and that relationship makes it compatible with a huge range of statistical methods that are built on variance, including regression, analysis of variance, and most hypothesis tests. It's also the basis for z-scores, which describe how many standard deviations a value sits from the mean — our guide on what a z-score means and how to calculate it covers this in more depth, and if you need to compare values across two different data sets, our guide to using z-scores to compare different data sets builds on the same idea. If you'd like to try it yourself, 100 Calculator's Z Score Calculator does the math for you.
Standard deviation also shows up constantly in hypothesis testing and p-values, which rely on the spread of your data to judge whether a result is likely due to chance. If that's new territory for you, our guide on what a p-value really tells you is a good next stop.
Common Mistakes When Comparing These Two Measures
A few misunderstandings come up often enough that they're worth calling out directly.
- Comparing MAD and standard deviation as if they're interchangeable. They're related, but they're not the same number measured two ways — standard deviation will almost always come out higher for the same data.
- Using the wrong denominator for standard deviation. Dividing by n when you actually have a sample (or by n − 1 when you have full population data) gives you a slightly inaccurate result.
- Forgetting the absolute value step in MAD. Skip it, and the positive and negative deviations cancel out, leaving you with a result at or near zero regardless of how spread out the data actually is.
- Stopping at variance instead of standard deviation. Variance is a real, useful statistic, but its squared units make it hard to interpret directly — the square root step matters.
- Assuming a small MAD or standard deviation always means "good" data. What counts as small depends entirely on the scale of your data; a spread of 2 is tiny for test scores out of 1,000, but large for scores out of 10.
- Treating standard deviation as resistant to outliers. It's actually the opposite — standard deviation is more sensitive to outliers than mean absolute deviation, not less.
Real-World Examples of Mean Absolute Deviation and Standard Deviation
Both measures show up across a wide range of fields, though standard deviation tends to dominate once you move into formal analysis.
| Field | Measure Typically Used | Why |
|---|---|---|
| Investing & finance | Standard deviation | Used as the standard measure of volatility and feeds directly into risk models |
| Manufacturing & quality control | Standard deviation | Control charts and process capability studies are built around it |
| Weather forecasting | Mean absolute error (MAD's forecasting cousin) | Stays in easy-to-read original units without overweighting rare, extreme misses |
| Education & testing | Both, depending on the course | Standard deviation for formal grading curves; MAD often taught first to introduce the concept |
| Scientific research | Standard deviation | Required for confidence intervals, error bars, and significance testing |
Mean absolute deviation still plays an important role even in fields dominated by standard deviation. Mean absolute error, which is nearly identical in structure to MAD, is one of the most widely used ways to report how accurate a forecast or prediction model is, exactly because it's easy to interpret and doesn't let a single bad prediction distort the overall picture.
Related Calculators
Put what you just read into practice, try these free tools instantly, no sign-up required.
Interval of Convergence Calculator
Find the interval of convergence for any power series.
Mean Absolute Deviation Calculator
Calculate the mean absolute deviation for any data set.
P Value Calculator
Calculate the p-value for your hypothesis test statistic.
Volume of a Sphere Calculator
Calculate the volume of a sphere from its radius or diameter.
Z Score Calculator
Calculate the z-score for a value within a normal distribution.
How to Calculate Both With 100 Calculator's Tools
Working through the formulas by hand is worth doing at least once, since it builds real understanding of what each measure is doing. Once you're comfortable with that, an online calculator saves time and avoids arithmetic mistakes, especially with larger data sets.
Free Online Tool
Skip the manual math
100 Calculator's Mean Absolute Deviation Calculator runs right in your browser. Enter your data set and it instantly returns the mean absolute deviation, with no account or signup required.
If your next step is z-scores, confidence intervals, or hypothesis testing, our Z Score Calculator and P Value Calculator pick up right where standard deviation leaves off, so you can go from raw data to a full statistical analysis without switching tools.
More From Math & Statistics
Want to keep building your statistics foundation? These related guides from the same category dig deeper into nearby topics.
Frequently Asked Questions
What is the difference between mean absolute deviation and standard deviation?
Mean absolute deviation (MAD) averages the absolute distance of each data point from the mean, while standard deviation squares each distance before averaging and then takes the square root. Both measure how spread out a data set is, but standard deviation gives more weight to values that are far from the mean because squaring makes large gaps count more heavily. MAD tends to be simpler to calculate and easier to explain, while standard deviation connects to more advanced statistical tools like z-scores and the normal distribution.
Which is better, mean absolute deviation or standard deviation?
Neither measure is universally better since they serve different purposes. Mean absolute deviation is easier to understand and less affected by extreme values, which makes it useful for a quick, intuitive read on spread. Standard deviation is the standard choice for most formal statistical work because it fits naturally into calculations like variance, confidence intervals, and hypothesis testing. Your choice should depend on whether you need simplicity or compatibility with wider statistical methods.
Why do statisticians use standard deviation instead of just mean absolute deviation?
Standard deviation has mathematical properties that make it easier to work with in advanced statistics. It's differentiable, which matters for optimization methods, and it connects directly to variance, the normal distribution, and z-scores. Mean absolute deviation lacks these same connections, so while it's simpler for everyday use, standard deviation became the default for most statistical modeling, research, and finance over the past century.
What is the formula for mean absolute deviation?
The formula is MAD = (sum of |x − mean|) ÷ n. In plain terms, you subtract the mean from every data point, ignore the positive or negative sign so each distance becomes a positive number, add all of those distances together, and divide by the total number of values, n. The result is the average distance each data point sits from the mean.
What is the formula for standard deviation?
For a full population, standard deviation equals the square root of the average of each squared difference from the mean: σ = √[Σ(x − x̄)² ÷ n]. For a sample, you divide by n − 1 instead of n: s = √[Σ(x − x̄)² ÷ (n − 1)]. Both versions subtract the mean from each value, square that difference, average the squared differences, and then take the square root to bring the result back into the original units.
Is mean absolute deviation always smaller than standard deviation?
For any data set, standard deviation is mathematically guaranteed to be greater than or equal to mean absolute deviation — this follows from how squaring works in the standard deviation formula. The two measures are only equal when every data point sits exactly the same distance from the mean, which is rare outside of very simple, symmetric data sets. In practice, this means standard deviation will almost always report a slightly higher value than mean absolute deviation for the same data.
When should I use mean absolute deviation instead of standard deviation?
Mean absolute deviation works well when you want a simple, easy-to-explain measure of spread, especially for beginners or non-technical audiences. It's also a reasonable choice when your data contains outliers you don't want to dominate the result, since it doesn't amplify large gaps the way squaring does. Introductory statistics courses often teach MAD first for exactly this reason.
When should I use standard deviation instead of mean absolute deviation?
Standard deviation is the better choice when you're working with data that follows, or roughly follows, a normal distribution, or when you need to run further calculations like z-scores, confidence intervals, or hypothesis tests. It's also the expected measure in fields like finance, science, and engineering, where standard deviation is the established convention.
Does mean absolute deviation use n or n minus 1 in the formula?
Mean absolute deviation almost always divides by n, the total number of data points, rather than n − 1. The n − 1 adjustment, known as Bessel's correction, is specific to sample standard deviation and sample variance, where it corrects for the fact that a sample tends to slightly underestimate the true variability of the full population.
What is the relationship between variance and standard deviation?
Variance is the average of the squared deviations from the mean, and standard deviation is simply the square root of variance. Variance is useful in calculations because it has convenient mathematical properties, but its units are squared, which makes it hard to interpret directly. Taking the square root to get standard deviation brings the result back into the same units as the original data, making it far easier to interpret.
Why is standard deviation more sensitive to outliers than mean absolute deviation?
Standard deviation squares each deviation before averaging, and squaring disproportionately increases the influence of large values. A data point that's 10 units from the mean contributes 100 to the sum in the standard deviation formula, but only 10 to the sum in the mean absolute deviation formula. That's why a single extreme value can pull standard deviation up much more sharply than it pulls mean absolute deviation.
Can mean absolute deviation be negative?
No. Mean absolute deviation can never be negative because it's built entirely from absolute values, which are always zero or positive. The smallest possible value is zero, and that only happens when every single data point in the set is identical to the mean, meaning there's no spread at all.
What counts as a "good" mean absolute deviation value?
There's no universal "good" MAD value, since it depends entirely on the scale and context of your data. A MAD of 2 might indicate very little spread for test scores out of 100, but a lot of spread for a data set where most values cluster within a range of 5. The most useful way to interpret MAD is by comparing it to the scale of your specific data set or to the MAD of a similar data set.
How do you interpret standard deviation in plain language?
Standard deviation tells you, on average, how far individual data points typically sit from the mean, factoring in that larger gaps count more heavily. A small standard deviation means most values cluster tightly around the mean, while a large standard deviation means values are spread out more widely. For roughly normal data, about 68% of values fall within one standard deviation of the mean.
Is mean absolute deviation the same thing as average deviation?
"Average deviation" is sometimes used as another name for mean absolute deviation, though the terminology can vary between textbooks and courses. Some sources use "mean deviation" as a broader term that could technically be measured from the mean, median, or another central point, so it's worth checking which specific definition your course or source is using if the wording feels ambiguous.
Do mean absolute deviation and standard deviation use the same units as the original data?
Yes, both measures return results in the same units as your original data set. Mean absolute deviation stays in the original units throughout the calculation because it never squares anything. Standard deviation does square the deviations partway through the formula, but taking the square root at the end brings the units back to match the original data, which is exactly why the square root step matters.
About 100 Calculator
100 Calculator is a free hub of online calculators and educational guides covering health, finance, trading, crypto, education, math, and more. Every tool is built to be fast, accurate, and genuinely free, with no account or signup required.
We built this guide, and tools like the Mean Absolute Deviation Calculator referenced throughout it, to make statistics concepts like measures of spread easier to understand and calculate. Head back to the 100 Calculator homepage to explore the full library of tools, or learn more about the team behind them on our About Us page.