What a P Value Really Tells You About Significance
A plain-English breakdown of what a p value actually measures, how to interpret one correctly, and the misunderstandings that trip up students and experienced researchers alike.
Open almost any research paper, A/B test report, or statistics assignment, and a p value is staring back at you. Maybe it's 0.03. Maybe it's 0.41. Either way, it's easy to glance at that number, decide "significant" or "not significant," and move on without really understanding what you just read.
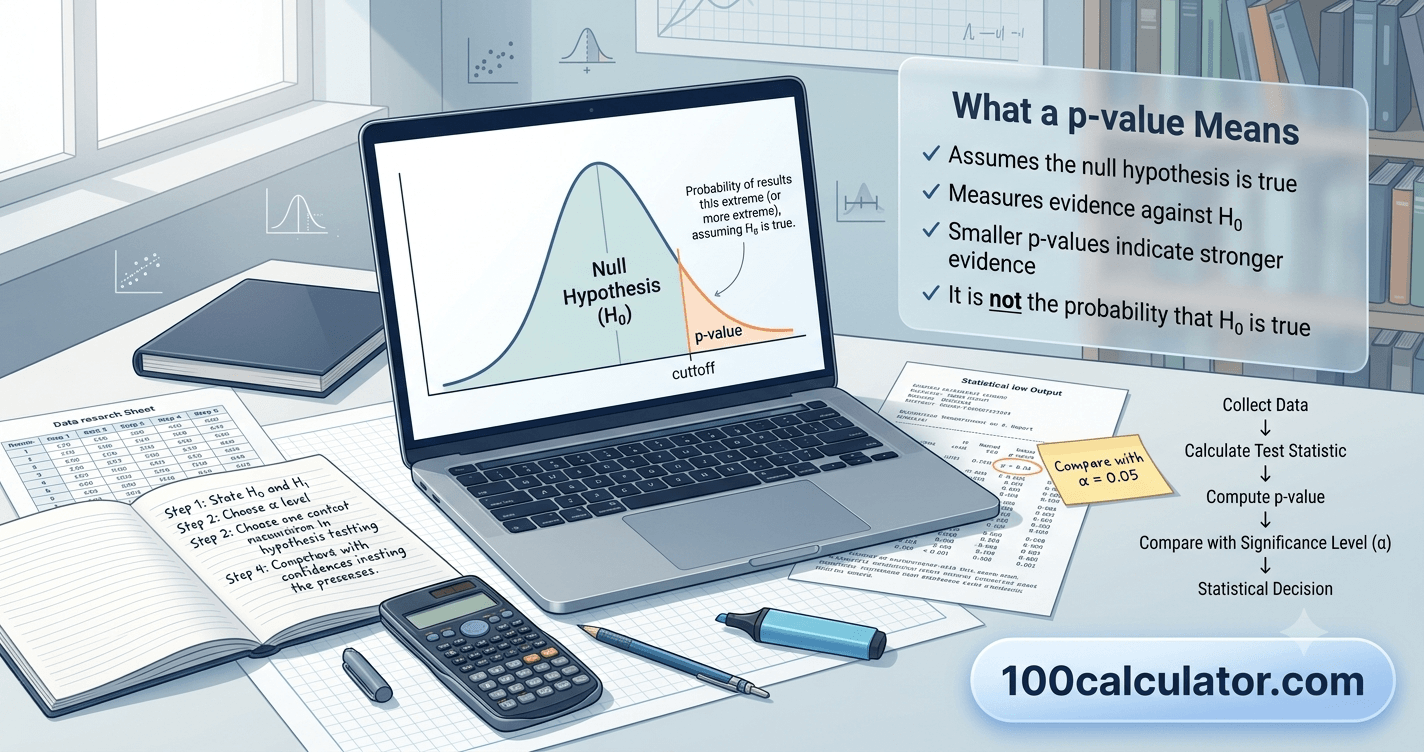
A p value is the probability of getting a result as extreme as the one you observed, assuming the null hypothesis is true. It measures how surprising your data would look if there were actually no real effect or difference happening. A small p value means your result would be unusual under that assumption, which counts as evidence against the null hypothesis — but it is not proof that your hypothesis is correct, and it says nothing about how large or important your effect actually is.
If you already have a test statistic in hand, 100 Calculator's P Value Calculator converts it into a p value in seconds, for one-tailed or two-tailed tests. But knowing which number to enter, and what the result actually tells you, matters just as much as getting the number itself.
This guide breaks down what a p value really measures, walks through how it's calculated, and spends real time on the misconceptions that trip up students and researchers alike. By the end, you'll be able to read a p value in a paper or a spreadsheet and know exactly what it is, and isn't, telling you.
What Is a P Value? A Quick, Clear Definition
A p value, short for "probability value," is a single number that comes out of a statistical hypothesis test. It always falls between 0 and 1, and it answers one specific question: if there were truly no effect or difference in the real world, how likely would it be to see data like yours just by chance?
The Formal Definition, Broken Down
The textbook definition sounds intimidating: the probability of obtaining a test statistic at least as extreme as the one observed, assuming the null hypothesis is true. Broken into pieces, it's more manageable.
- "Probability" simply means a number between 0 and 1.
- "Test statistic" is the specific number your data produced, like a t-value or z-score.
- "At least as extreme" means as far, or farther, from what you'd expect if nothing were going on.
- "Assuming the null hypothesis is true" is the key condition — the p value only makes sense within that assumption.
The General Idea
p-value = P(test statistic this extreme or more extreme | H₀ is true)
P(...): the probability of an event happening
H₀: the null hypothesis — the "no effect" or "no difference" assumption
"this extreme or more extreme": as far, or farther, from what H₀ predicts, in the direction your test is checking
A Simple Example You Can Picture
Imagine you flip a coin 20 times to test whether it's fair. Under the null hypothesis, a fair coin with 50/50 odds, you'd expect around 10 heads. If you actually got 15 heads, the p value answers: how likely is it to get 15 or more heads out of 20 flips if the coin really were fair? If that probability turns out to be small, say 0.04, it suggests the "fair coin" assumption might not hold.
The Basics of Hypothesis Testing
A p value never stands alone. It only makes sense inside the framework of a hypothesis test, so it helps to understand the pieces around it first.
The Null Hypothesis and Alternative Hypothesis
Every hypothesis test starts with two competing statements. The null hypothesis, written H₀, usually claims there's no effect, no difference, or no relationship — it's the "nothing interesting is happening" position. The alternative hypothesis, H₁ or Hₐ, is what you're actually trying to find support for, like "this new study method improves test scores" or "this website redesign increases signups."
A hypothesis test never proves the alternative hypothesis directly. Instead, it checks whether your data gives you enough reason to reject the null hypothesis in favor of it. For a deeper walkthrough of this process in action, our guide on how to interpret a p value in hypothesis testing covers it step by step.
Setting a Significance Level Before You Start
Before collecting or analyzing data, researchers pick a significance level, usually written as alpha (α), most commonly 0.05. This is the threshold the p value will later be compared against. Deciding on this number in advance matters — choosing it after seeing results defeats the purpose and opens the door to bias.
Key Terms You'll Run Into
| Term | What It Means |
|---|---|
| Null hypothesis (H₀) | The default claim of no effect or no difference |
| Alternative hypothesis (H₁) | What you're testing in favor of |
| Significance level (α) | The threshold chosen before testing, often 0.05 |
| Test statistic | The specific number calculated from your sample data |
| P value | The probability tied to that test statistic under H₀ |
| Confidence interval | A range of plausible values for the true effect |
How a P Value Is Actually Calculated
You don't need to run these calculations by hand to use a p value correctly, but understanding the general process makes the result much easier to trust and interpret.
The General Process
- State your null and alternative hypotheses.
- Collect your data and choose the appropriate statistical test.
- Calculate the test statistic, such as a t-value, z-score, or chi-square value, from your sample.
- Compare that test statistic to its expected probability distribution under the null hypothesis.
- Read off the probability of a result this extreme or more extreme — that's your p value.
Common Statistical Tests That Produce a P Value
Different situations call for different tests, but each one follows the same basic idea above. A few of the most common:
- t-test: comparing the means of one or two groups
- Chi-square test: checking whether categorical data matches an expected pattern
- ANOVA: comparing means across three or more groups
- Correlation test: checking whether two variables are related
How to Interpret a P Value the Right Way
Once you have a p value, interpreting it correctly comes down to comparing it with your significance level and being honest about what that comparison does, and doesn't, prove.
What a Low P Value Suggests
A p value at or below your significance level, commonly 0.05, suggests your data would be unusual if the null hypothesis were actually true. Statisticians describe this as a "statistically significant" result, and it's usually treated as evidence against the null hypothesis, in favor of the alternative.
What a High P Value Suggests
A p value above your threshold means your data isn't surprising enough under the null hypothesis to reject it. This is usually phrased as "failing to reject the null hypothesis," a deliberately careful phrase, since it isn't the same as proving the null hypothesis is true.
Common Significance Thresholds
| Threshold | Common Label | Typical Use |
|---|---|---|
| 0.10 | Marginal / weak evidence | Early-stage or exploratory research, where missing a real effect is costlier than a false alarm |
| 0.05 | Standard threshold | Most academic research and general studies |
| 0.01 | Strict threshold | Fields where false positives are especially costly, such as medical trials or safety testing |
What a P Value Does NOT Tell You
This is where most of the confusion about p values actually happens, and it's worth slowing down here.
It's Not the Probability Your Hypothesis Is True
This is the single most common misreading of a p value. A p value describes how likely your data is, assuming the null hypothesis is true — it does not describe how likely your hypothesis is, given your data. Those are two very different questions, and mixing them up is common enough that statisticians have a name for it: the "prosecutor's fallacy."
A Small P Value Doesn't Mean a Large Effect
A tiny p value tells you an effect is unlikely to be pure chance. It says nothing about how big that effect actually is. With a large enough sample, even a trivially small, practically meaningless difference can produce an extremely small p value.
Statistical Significance Isn't the Same as Practical Importance
A result can be statistically significant and still be too small to matter in the real world. Before treating a significant p value as a green light for action, it's worth asking whether the actual size of the effect justifies a decision, not just whether it cleared a probability threshold.
| Common Belief | What's Actually True |
|---|---|
| "It tells you the probability your hypothesis is true." | It only tells you how likely your data would be if the null hypothesis were true — a very different question. |
| "A smaller p value always means a bigger effect." | P values reflect certainty an effect exists, not its size. A tiny effect can still produce a very small p value with a large enough sample. |
| "A p value above 0.05 proves there's no effect." | It only means the data didn't provide strong enough evidence against the null hypothesis — the study may simply be too small. |
| "P values tell you whether a result will replicate." | A single p value says nothing about whether the result would show up again; replication needs independent testing. |
P Value vs Significance Level (Alpha): What's the Difference?
These two numbers get confused constantly because they're compared directly against each other, but they represent different things.
| Aspect | P Value | Significance Level (Alpha) |
|---|---|---|
| When it's set | Calculated after running the test | Chosen before the test begins |
| What it represents | The exact probability tied to your data | The threshold you'll compare it against |
| Changes per study? | Yes, different every time | No, typically fixed at 0.05 or another value |
| Decision rule | Compared against alpha to decide | The benchmark the p value must beat |
In short, alpha is the line you draw before the test. The p value is where your specific result actually lands relative to that line.
One-Tailed vs Two-Tailed P Values
Before running a test, you also need to decide whether you're checking for an effect in one specific direction, or in either direction. That choice changes how the p value is calculated.
When a One-Tailed Test Makes Sense
A one-tailed test only makes sense when you have a specific, justified reason to care about just one direction of change, decided before looking at the data. Testing whether a new fertilizer increases crop yield, when there's no realistic scenario where it would decrease yield, could justify a one-tailed approach.
Why Two-Tailed Is the Safer Default
A two-tailed test checks for a difference in either direction, which better matches how most real research questions are actually framed. It's also more conservative, so it's the standard choice unless there's a strong, pre-established reason to do otherwise.
| Aspect | One-Tailed Test | Two-Tailed Test |
|---|---|---|
| Tests for | An effect in one specific, predicted direction | A difference in either direction |
| When to use | Only one direction is meaningful, decided in advance | The default choice for most research questions |
| P value size | Smaller, for the same data | Larger, since it accounts for both directions |
| Risk of misuse | Choosing this after seeing the data | Low risk; generally the safer default |
How Sample Size and Effect Size Change Your P Value
P values are sensitive to how much data you collect, which is one of their most misunderstood quirks.
Why Bigger Samples Produce Smaller P Values
As your sample size grows, your estimates become more precise, and smaller true differences become easier to detect. A real, even tiny, effect will eventually produce a small p value if you collect enough data, which is exactly why a significant result needs to be paired with a look at how large the effect actually is.
Effect Size: The Piece P Values Leave Out
Effect size measures how big a difference or relationship actually is, independent of sample size. Common measures include Cohen's d for comparing group means, or a simple percentage difference. Reporting effect size alongside a p value gives a fuller picture: one tells you whether an effect is likely real, the other tells you whether it's worth caring about. If you're also working with standardized scores, our guide on what a z score means and how to calculate it covers a closely related concept that often shows up in the same calculations, and our piece on mean absolute deviation vs standard deviation digs deeper into measuring spread.
Common Mistakes People Make When Reading P Values
A handful of habits account for most of the confusion around p values, in classrooms and published research alike.
- Treating 0.05 as a magic bright line instead of one conventional threshold among several
- Calling a p value between 0.05 and 0.10 "trending toward significance," which isn't a real statistical category
- Reporting a p value without also reporting the effect size or a confidence interval
- Running many comparisons and only highlighting the one that happened to be significant
- Assuming a non-significant result proves there's no effect, instead of considering the study might be underpowered
- Confusing statistical significance with real-world importance
P-Hacking and Multiple Comparisons
P values only work as intended when a test is planned and run honestly. A few common practices quietly break that assumption.
What P-Hacking Looks Like
P-hacking describes trying many different analyses, removing outliers selectively, or testing multiple outcomes until something crosses the significance threshold, then reporting only that result. It's rarely done with obvious bad intent — it often just looks like ordinary exploratory analysis that goes unreported.
Why Testing Many Things Increases False Positives
Every individual test carries some chance of a false positive, even when nothing real is happening. Run 20 independent tests at a 0.05 significance level, and you'd expect roughly one of them to come back "significant" by chance alone. This is known as the multiple comparisons problem.
Ways Researchers Guard Against This
Pre-registering a study's hypotheses and analysis plan before collecting data is one of the strongest protections, since it prevents changing the approach after seeing the results. Statistical corrections like the Bonferroni correction also adjust the significance threshold when multiple tests are run, making it harder for chance alone to produce a "significant" result.
How to Calculate a P Value Step by Step
Once you understand what a p value represents, actually calculating one comes down to a short, repeatable process.
Free Online Tool
Skip the distribution tables
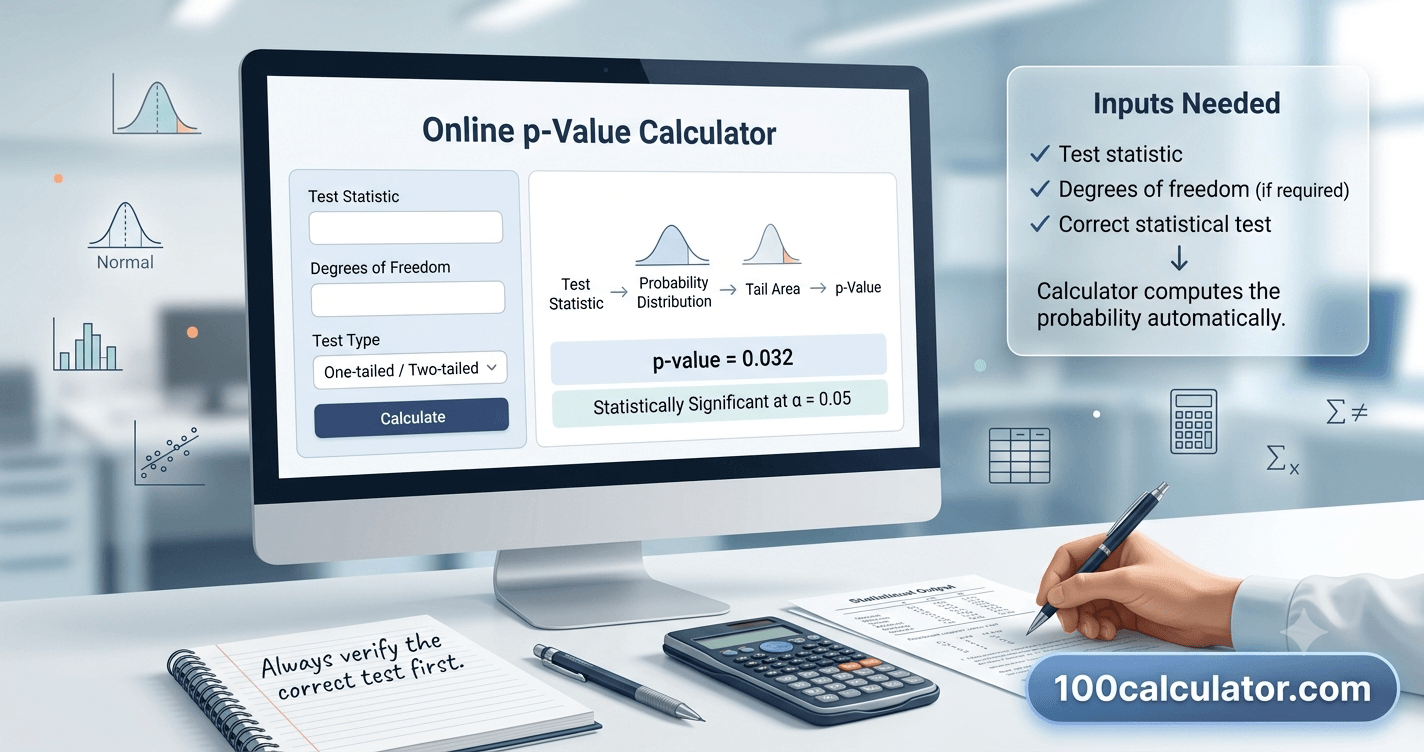
100 Calculator's P Value Calculator converts a test statistic straight into a p value, for z-tests, t-tests, and chi-square tests, with support for one-tailed and two-tailed results.
What You'll Need Before You Start
- Your test statistic (z, t, or chi-square value) from your data — if you need to work out a z-score first, 100 Calculator's Z Score Calculator covers that step
- Degrees of freedom, if your test requires them — t-tests and chi-square tests do; z-tests don't
- Whether you're running a one-tailed or two-tailed test
Using a Calculator Instead of Manual Tables
- Run your statistical test and note the resulting test statistic.
- Identify your degrees of freedom, if the test uses them.
- Decide whether you need a one-tailed or two-tailed result, ideally before you saw your data.
- Enter these values into a P Value Calculator to get your p value instantly.
- Compare the result to your pre-chosen significance level to decide whether to reject the null hypothesis.
Related Calculators
Put what you just read into practice, try these free tools instantly, no sign-up required.
Interval of Convergence Calculator
Find the interval of convergence for any power series.
Mean Absolute Deviation Calculator
Calculate the mean absolute deviation for any data set.
P Value Calculator
Calculate the p-value for your hypothesis test statistic.
Volume of a Sphere Calculator
Calculate the volume of a sphere from its radius or diameter.
Z Score Calculator
Calculate the z-score for a value within a normal distribution.
P Values in Real-World Research and Decisions
P values show up far beyond statistics classrooms. Here's how they're actually used across a few different fields.
In Medicine and Clinical Trials
Clinical trials use p values to help decide whether a new treatment performs meaningfully better than a placebo or an existing treatment. Because incorrect conclusions can affect patient safety, many trials use stricter significance thresholds and require a result to be confirmed across multiple independent studies before it changes medical guidance.
In Business and A/B Testing
Companies running A/B tests on websites or apps use p values to judge whether a new design, headline, or feature actually changed user behavior, or whether the difference could just be random noise. A statistically significant result is often treated as a green light, though many teams also check whether the improvement is large enough to justify the cost of rolling it out.
In Social Science Research
Psychology, economics, and education research rely heavily on p values to test theories about human behavior. Because human behavior is naturally variable, these fields have also driven much of the modern conversation about p-hacking and replication, since one significant result is far less convincing than the same finding repeated across independent studies.
A note on this guide: This article explains p values and statistical significance at a conceptual level for general educational purposes. It isn't a substitute for formal statistics coursework or guidance from a qualified statistician, especially when designing a study, choosing a significance threshold, or interpreting results that will inform an important decision.
More From Math & Statistics Guides
Still working through statistics concepts? These related guides dig deeper into the topics covered above.
Frequently Asked Questions
What does a p value actually mean?
A p value is the probability of getting a result as extreme as the one you observed, or more extreme, if the null hypothesis were actually true. It's a measure of how surprising your data would be under the assumption that there's no real effect. A small p value means your result would be unusual under that assumption, which is evidence against the null hypothesis, not proof that your hypothesis is correct.
What is considered a "good" p value?
There's no universally "good" p value, only thresholds that researchers agree on before running a test. Many fields use 0.05 as the cutoff for statistical significance, meaning a p value below that is considered strong enough evidence to reject the null hypothesis. Stricter fields, like particle physics, use far smaller thresholds. The right threshold depends on how costly a false positive would be in that specific context.
Is a p value of 0.05 always the right cutoff?
No. The 0.05 threshold is a convention, not a law of statistics. It became standard mostly because early statisticians found it to be a reasonable balance between catching real effects and avoiding false positives in typical research. Fields where mistakes are expensive, like medicine or manufacturing safety, often use stricter cutoffs like 0.01. Always check what threshold is standard for your specific field before assuming 0.05 applies.
Does a small p value mean my hypothesis is true?
No. A small p value only tells you that your data would be unlikely if the null hypothesis were true, so it gives you reason to reject that null hypothesis. It doesn't prove your alternative hypothesis is correct, and it doesn't rule out other explanations like a flawed study design, a confounding variable, or random chance producing an unusual result. Replication across multiple studies is what builds real confidence.
What does it mean if my p value is greater than 0.05?
A p value above 0.05 means your data isn't unusual enough, under the null hypothesis, to justify rejecting it at that threshold. This is often described as "failing to reject the null hypothesis." It doesn't prove the null hypothesis is true either; it may simply mean your sample was too small to detect a real effect, or that the effect genuinely doesn't exist.
Can a p value be exactly 0?
In practice, a calculated p value can round down to 0.000 when it's extremely small, but it's never mathematically exactly zero. There's always some non-zero probability, however tiny, of observing your result if the null hypothesis were true. When software displays "p < 0.001," it means the exact value is smaller than that reporting threshold, not that it's literally zero.
What's the difference between a p value and a confidence interval?
A p value gives you a single number describing how compatible your data is with the null hypothesis. A confidence interval gives you a range of plausible values for the actual effect size, which is often more useful because it shows both the size and the precision of your estimate. Many statisticians recommend reporting both together rather than relying on a p value alone.
What is p-hacking?
P-hacking is the practice of running many different analyses, tweaking variables, or testing multiple outcomes until one produces a p value below 0.05, then reporting only that result. It inflates the chance of a false positive because testing enough combinations will eventually turn up a significant-looking result by chance alone, even when no real effect exists. Pre-registering a study's methods before collecting data helps prevent it.
Does a bigger sample size always give a smaller p value?
Not automatically, but larger samples generally make it easier to detect a real effect, which tends to lower the p value if an effect truly exists. With a large enough sample, even a tiny, practically meaningless difference can produce a statistically significant p value. That's why effect size and practical importance matter just as much as the p value itself.
What's the difference between statistical significance and practical significance?
Statistical significance just means a result is unlikely to be due to chance, based on your chosen threshold. Practical significance asks whether the size of that effect actually matters in the real world. A large study can find a statistically significant difference that's too small to matter for real decisions, while a smaller study might miss a genuinely important effect simply because it lacked enough data.
Should I use a one-tailed or two-tailed p value?
A two-tailed test is the safer default because it checks for a difference in either direction, which matches how most research questions are actually framed. A one-tailed test only makes sense when you have a specific, pre-determined reason to care about just one direction of effect, decided before you look at the data. Switching to one-tailed after seeing results is a form of p-hacking.
What is Type I error and how does it relate to the p value?
A Type I error happens when you reject a null hypothesis that was actually true, essentially a false positive. Your chosen significance level, usually 0.05, sets the maximum rate of Type I errors you're willing to accept before running the test. The p value tells you, after the fact, whether your specific result crossed that threshold.
Can I calculate a p value without special software?
For simple tests, yes, using statistical tables and the formula for your specific test statistic. In practice, almost everyone uses a calculator or software instead, since it removes the risk of manual errors and works instantly for more complex tests. 100 Calculator's P Value Calculator handles this by taking your test statistic and giving you the corresponding p value right away.
What information do I need to use a p value calculator?
Most p value calculators ask for your test statistic, such as a z-score, t-value, or chi-square value, your degrees of freedom if the test requires them, and whether you're running a one-tailed or two-tailed test. Once you enter those details, 100 Calculator's P Value Calculator applies the correct probability distribution and returns your p value instantly.
About 100 Calculator
100 Calculator is a free hub of online calculators and educational guides covering math, statistics, health, finance, trading, crypto, and more. Every tool is built to be fast, accurate, and genuinely free, with no account or signup required.
We built this guide, along with tools like the P Value Calculator referenced throughout it, to make statistics concepts easier to actually use, not just memorize. Head back to the 100 Calculator homepage to explore the full library of tools, or learn more about the team behind them on our About Us page.