Why Large Drawdowns Are So Hard to Recover From
The math behind losses and gains isn't symmetrical, and that single fact explains almost everything about why big drawdowns wreck accounts. Here's exactly why a 50% loss is so much more dangerous than a 10% one, and what to do about it.
Losing money is never fun, but there's a specific kind of frustration that comes from watching a trading account or portfolio fall sharply and then realizing just how much it needs to gain back to break even. That frustration isn't in your head. It's math.
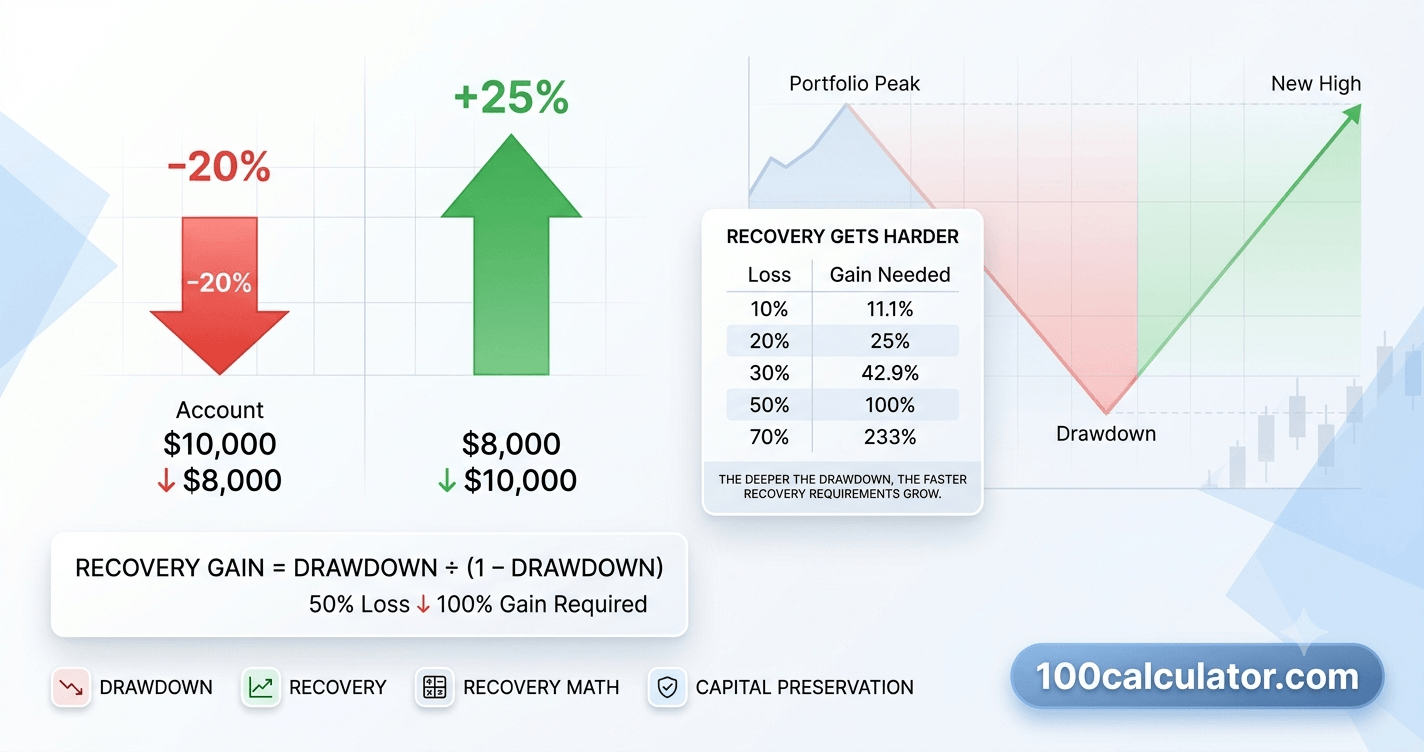
A drawdown is the percentage an account falls from its most recent peak, and the gain needed to recover from one grows faster than the loss itself: a 10% drawdown only needs an 11.1% gain to break even, but a 50% drawdown needs a full 100% gain, because losses and gains are calculated on different amounts of money. That single mismatch is why large drawdowns feel so much more dangerous than small ones, and why so many traders and investors never fully recover from one.
This guide walks through exactly why that math works the way it does, how long real drawdowns have historically taken to recover from, and what actually causes accounts to fall that far in the first place. If you want to run your own numbers as you read, 100 Calculator's Drawdown Recovery Calculator does the math instantly, and we'll walk through exactly how to use it later in this guide.
First, it helps to be precise about what a "drawdown" actually means, since it's a term that gets used a little loosely.
What Is a Drawdown, Really?
A drawdown is the percentage decline in the value of an investment, trading account, or portfolio measured from its most recent high point down to its lowest point afterward, before it turns around. It has nothing to do with how much you originally deposited. If an account grows from $10,000 to $20,000 and then falls to $14,000, that's a 30% drawdown, calculated against the $20,000 peak, not the original $10,000.
Drawdowns are a completely normal part of trading and investing. Every strategy, every fund, and every long-term investor experiences them. What separates a manageable drawdown from a dangerous one is mostly a matter of size and how it's handled, which is exactly what the rest of this guide covers.
Drawdown vs. a Realized Loss
A drawdown isn't automatically the same thing as a realized loss. If you're still holding a position or still invested, a drawdown is "unrealized," meaning it exists on paper and can shrink or disappear entirely if the price recovers before you sell. A realized loss, on the other hand, is locked in the moment you close a position or sell an asset while it's down. This distinction matters because panic-selling during a drawdown is exactly what turns a temporary, unrealized decline into a permanent, realized one.
What Is Maximum Drawdown (MDD)?
Maximum drawdown, often shortened to MDD, is the single largest peak-to-trough decline a strategy, fund, or account has experienced over a given period. It's one of the most widely used risk metrics in trading and investing because it answers a very practical question: at the worst possible moment, how much of your capital was actually on the line? Two strategies can have similar average returns but very different maximum drawdowns, and the one with the smaller MDD is generally considered less risky, since it asks less of an investor's nerves along the way.
The Math Behind Drawdown Recovery
Here's the part that trips people up: losses and gains are not mirror images of each other, even though they feel like they should be. A 20% loss and a 20% gain sound like they should cancel out, but they don't, because each percentage is calculated against a different amount of money.
The Recovery Percentage Formula
If you lose a percentage of your capital, the gain required to get back to even is always larger than the loss itself. The relationship follows a simple formula:
Formula
Gain Needed to Break Even = Loss ÷ (1 − Loss) × 100
Loss is the drawdown written as a decimal. A 30% loss is entered as 0.30.
Result is the percentage gain required on your remaining balance just to return to your starting point, before any actual profit.
Notice what's happening in that formula: after a loss, you're no longer working with your original balance. You're working with a smaller number, and that smaller number has to grow by a bigger percentage to climb back to where you started. The deeper the hole, the smaller your remaining base, and the harder it has to work.
Loss vs. Gain Needed to Break Even
Running that formula across a range of common drawdown sizes makes the pattern impossible to miss:
| Drawdown (Loss) | Gain Needed to Break Even |
|---|---|
| 5% | 5.3% |
| 10% | 11.1% |
| 15% | 17.6% |
| 20% | 25.0% |
| 25% | 33.3% |
| 30% | 42.9% |
| 40% | 66.7% |
| 50% | 100.0% |
| 60% | 150.0% |
| 70% | 233.3% |
| 80% | 400.0% |
| 90% | 900.0% |
Up to about a 20% drawdown, the gain needed stays fairly close to the loss itself. Past that point, the gap widens quickly. That's not a coincidence or a trick of the numbers; it's the direct result of losses shrinking the base that future gains have to be calculated from. Our related guide on how much return you need to recover from a drawdown walks through this same relationship with more worked examples.
Why a 50% Drawdown Is So Much Harder Than a 10% One
A 10% drawdown is an inconvenience. A 50% drawdown is a completely different problem, and not just because it's five times larger. Look back at the table above: a 10% loss needs an 11.1% gain to recover, which is a realistic target that a normal month or two of reasonable returns could plausibly deliver. A 50% loss needs a 100% gain, meaning your remaining money has to literally double before you're back to breakeven, let alone ahead.
Doubling an account isn't something that happens through ordinary, low-risk trading or investing. It usually requires either a very long stretch of compounding time, or a level of risk-taking that's more likely to produce another large drawdown than a clean recovery. That's the trap: the bigger the hole, the more tempting it becomes to take outsized risks to climb out of it quickly, which is often exactly how a 50% drawdown turns into a 70% or 80% one.
This is also why professional risk managers pay so much more attention to drawdown size than to individual losing trades. One 5% loss is a rounding error over a long trading career. A single 50% loss can undo years of otherwise solid gains, which is exactly why controlling the size of your worst-case drawdown matters more than trying to win every trade.
How Long Drawdown Recovery Actually Takes
The math above tells you how much you need to gain. It doesn't tell you how long that will actually take, and that second question matters just as much, since time is the resource most traders and investors underestimate.
Historical Examples From the Stock Market
Looking at how the broad U.S. stock market has recovered from its own major drawdowns gives a useful sense of scale. These figures are approximate, since exact recovery dates vary slightly depending on which specific peak and trough are used, but the overall pattern is well documented:
| Event | Approx. Decline | Approx. Time to Recover |
|---|---|---|
| 1929 Crash / Great Depression | ~86% | ~25 years |
| Black Monday (1987) | ~25% (single-day shock) | ~2 years |
| Dot-Com Bust (2000–2002) | ~49% | ~6–7 years |
| Global Financial Crisis (2007–2009) | ~55% | ~4–6 years |
| COVID-19 Crash (2020) | ~34% | ~5–6 months |
Two things stand out here. First, the size of the decline doesn't always predict how long recovery takes; the COVID crash was steep but short-lived, while the dot-com bust was smaller in percentage terms but took years longer to fully recover from. Second, even the broad market, which is about as diversified as a drawdown gets, has taken several years to recover from its worst declines. Individual stocks and leveraged trading accounts can fare considerably worse.
Why Individual Stocks Are Riskier Than the Broad Market
Research from Morgan Stanley Investment Management's Counterpoint Global group studied drawdowns across roughly 6,500 individual U.S. stocks between 1985 and 2024, and the results are a useful reality check for anyone holding concentrated positions. (Morgan Stanley) The typical stock in their sample lost 85% of its value from peak to trough, and more than half of the stocks studied never made it back to their old highs at all. Among the stocks that did eventually recover, the full round trip back to a prior peak took a median of roughly five years total, split fairly evenly between the fall and the climb back.
That's a meaningfully different picture from a diversified index. A single overconcentrated position can suffer a devastating, permanent drawdown even while the broader market is doing fine, which is one of the strongest arguments for diversification and disciplined position sizing, both of which we'll cover later in this guide.
The Psychology Behind Every Large Drawdown
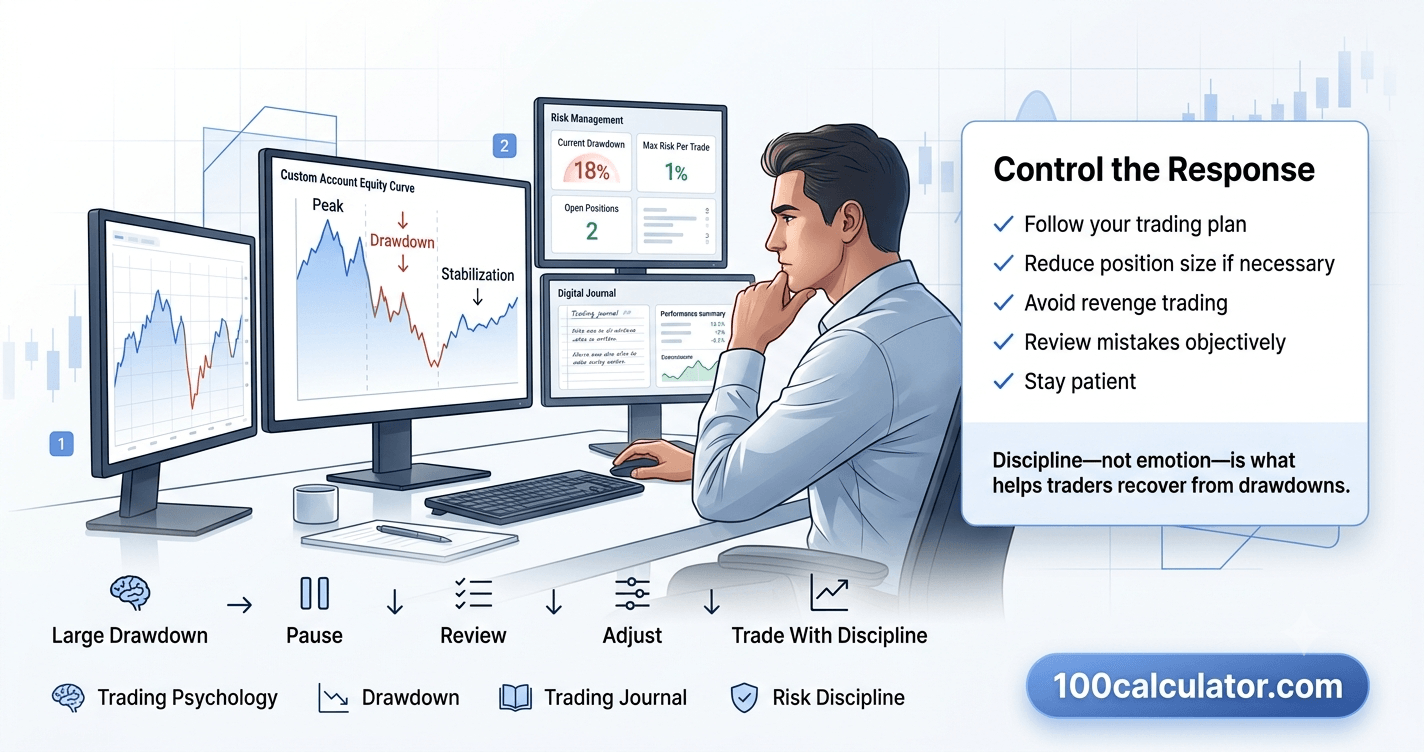
The math explains why big drawdowns are hard to recover from mathematically. Psychology explains why they're often hard to recover from at all, because the decisions people make during a drawdown frequently make it worse.
Loss Aversion: Why Losses Hurt More Than Gains Feel Good
Behavioral economists have long documented that losses tend to feel considerably more painful than equivalent-sized gains feel good, a pattern known as loss aversion. During a drawdown, that imbalance pushes people toward decisions driven by discomfort rather than strategy: selling at the bottom to make the pain stop, avoiding the market entirely afterward, or swinging to the opposite extreme and taking on far more risk than usual to "fix" the loss quickly.
Panic Selling and Revenge Trading
Panic selling locks in a drawdown that might otherwise have recovered on its own, turning an unrealized paper loss into a permanent, realized one. Revenge trading does the opposite kind of damage: instead of stepping back, a trader increases position size or trade frequency specifically to win back what was just lost, which is precisely the mindset that turns a 30% drawdown into a 60% one. Both patterns come from the same place, an urgent need to make the discomfort of the loss go away immediately, rather than accepting that recovery, if it comes, usually takes time.
What Causes Large Drawdowns in the First Place
Large drawdowns rarely come out of nowhere. In trading accounts especially, a handful of avoidable habits show up again and again behind the biggest losses.
Overleveraging
Leverage magnifies gains, but it magnifies losses by exactly the same amount, and it does so on a compressed timeline. A price move that would be a minor dip in an unleveraged account can wipe out a heavily leveraged one entirely. The more leverage involved, the smaller the adverse move needed to trigger a large, fast drawdown.
Poor Position Sizing
Putting too much capital into a single trade or a handful of correlated positions means one bad call can do outsized damage to the entire account. Our guide on position size mistakes every trader should avoid covers this in more depth, but the short version is that position sizing is often the single biggest lever a trader has over how large their worst drawdown ends up being.
Trading Without a Risk Management Plan
Entering trades without a predetermined stop-loss, maximum position size, or maximum daily or account-wide risk limit means every losing streak has the potential to keep going. Without limits decided in advance, the decision of when to stop is left to be made in the moment, exactly when emotions are running highest and judgment is least reliable.
A quick summary of the usual suspects:
- Using leverage that magnifies a normal price swing into a large drawdown
- Putting too much capital into one trade or one correlated group of positions
- Trading without a stop-loss or predefined exit plan
- Increasing size after losses instead of reducing it (revenge trading)
- Holding onto losing positions far longer than the original plan called for
Why So Many Day Traders Never Recover From a Big Loss
Day trading deserves its own section here, because the combination of frequent trades, leverage, and short timeframes makes large drawdowns especially common, and especially hard to recover from before capital, or confidence, runs out.
What the Research Actually Shows
Multiple independent studies, including reviews of retail brokerage accounts and academic research on futures and equity day traders, consistently find that most day traders lose money over time. A 2020 review by the Financial Industry Regulatory Authority (FINRA) found that a large majority of retail day traders finished the year with a net loss, and separate academic studies of day trading populations have found that only a small minority, often cited in the range of 1% to 4%, manage to be consistently profitable over multiple years. Estimates for the overall first-year failure rate vary by study and market, but commonly fall somewhere between 70% and 97%.
The reasons line up closely with everything covered earlier in this guide: undercapitalized accounts, leverage, poor position sizing, and the psychological pull toward revenge trading after a loss. A single large drawdown early on can wipe out the capital, and the confidence, needed to keep going long enough to develop real skill.
The Pattern Day Trader Rule Just Changed
For more than two decades, one of the best-known barriers for new U.S. day traders was FINRA's Pattern Day Trader (PDT) rule. Under the old version of Rule 4210, any margin account that executed four or more day trades within five business days was flagged as a "pattern day trader" and had to maintain at least $25,000 in equity at all times to keep trading, a requirement in place since 2001. (FINRA)
That changed on June 4, 2026. FINRA eliminated the $25,000 minimum equity requirement and the "pattern day trader" designation entirely, replacing them with a new intraday margin framework that checks whether an account holds enough real-time equity to support its actual open positions, rather than simply counting how many trades were placed. (FINRA) In practical terms, U.S. traders in margin accounts are no longer required to hold $25,000 purely to avoid a trade-count label, though individual brokers can still set their own account minimums, and traders still need enough real capital to absorb the risk of whatever they're actually trading.
How Much Drawdown Is Too Much?
There's no single number that applies to every trader or every strategy, but there are widely used guidelines worth knowing, along with the reasoning behind them.
The 3-5-7 Rule Explained
The 3-5-7 rule is an informal risk management guideline used by many retail traders. It isn't an official regulation, and different traders describe the exact details slightly differently, but the most common version works like this:
- 3: Risk no more than 3% of your account on any single trade.
- 5: Keep total risk across all open positions under 5% of your account at any one time.
- 7: Aim for winning trades to outperform losing trades by a ratio of at least 7%, so profitable trades carry more weight than losing ones.
The exact percentages matter less than the underlying idea: decide your risk limits before you place a trade, not while you're already in one.
Daily Drawdown vs. Maximum Drawdown Limits
Many proprietary trading firms distinguish between two different kinds of drawdown limits. A daily drawdown limit typically resets each trading day, calculated from that day's starting balance or equity, so one bad day doesn't permanently shrink how much risk is allowed going forward. A maximum drawdown limit, by contrast, usually tracks the account's peak value over its entire history and does not reset, since its whole purpose is to cap the worst-case decline from any point the account has ever reached. Always check the specific rules of your broker or firm, since definitions and reset schedules vary.
How to Calculate Your Own Drawdown Recovery
Understanding the formula is useful, but running your own numbers is what actually makes it practical.
Step-by-Step: Using the Drawdown Recovery Calculator
- Note your account's recent peak value — the highest balance it reached before the decline started.
- Note your current balance at the lowest point of the decline, or wherever it stands right now.
- Enter both numbers into the calculator to see your exact drawdown percentage and the precise gain required to break even.
- Compare that required gain to your strategy's typical returns to get a realistic sense of how long recovery might reasonably take.
Free Online Tool
Skip the manual math
100 Calculator's Drawdown Recovery Calculator runs right in your browser. Enter your peak and current balance, and it instantly shows your drawdown percentage and the exact gain needed to break even, with no account or signup required.
A Worked Example
Say a trading account grows to a peak of $50,000 and then falls to $35,000, a $15,000 decline. That works out to a 30% drawdown ($15,000 ÷ $50,000). Using the formula from earlier, the gain needed to break even is $15,000 ÷ $35,000, or about 42.9%, on the remaining $35,000. That's not the same as needing a 30% gain, which is the mistake it's easy to make when doing this math in your head instead of on paper. It's also a useful moment to check your numbers against 100 Calculator's Risk Reward Ratio Calculator or Trading Compound Interest Calculator to see how realistic that recovery timeline actually is given your typical returns.
Risk Management Strategies That Prevent Large Drawdowns
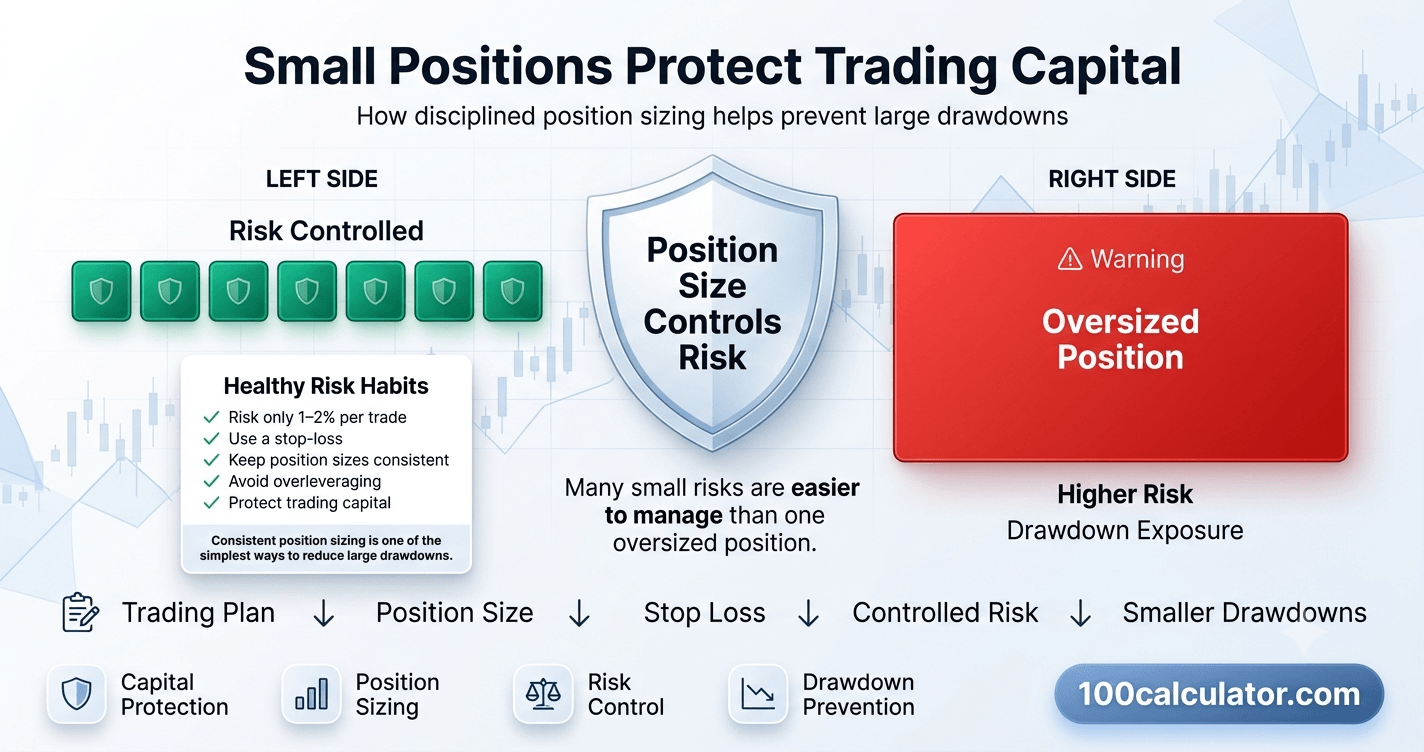
Recovering from a large drawdown is hard. Avoiding one in the first place is far more achievable, and it mostly comes down to a small set of disciplined habits.
Position Sizing Rules
Deciding how much to risk on any single trade before you enter it, and sticking to that limit regardless of how confident you feel, is the single most effective way to cap how large a drawdown can get. 100 Calculator's Position Size Calculator does this math for you based on your account size, risk tolerance, and stop-loss distance. Our guide on how to calculate position size for safer trading walks through the process step by step.
Diversification and Capital Preservation
Spreading capital across positions that aren't all likely to move in the same direction at the same time reduces the odds that any single event causes a catastrophic drawdown. This connects directly back to the individual-stock research covered earlier: a single concentrated position carries meaningfully more drawdown risk than a diversified one, simply because there's nothing to offset a bad outcome if it happens.
Setting Stop-Losses and a Personal Max Drawdown Rule
A predetermined stop-loss on individual trades caps the damage any single position can do. A personal maximum drawdown rule does the same thing at the account level, a predecided point (say, a 15% or 20% account decline) where you commit in advance to pause trading, reduce position sizes, or review your strategy before continuing. Our guide on what risk-reward ratio beginner traders should use pairs well with this idea, since favorable risk-reward ratios make it mathematically easier to stay profitable even without winning every trade.
Related Calculators
Put what you just read into practice, try these free tools instantly, no sign-up required.
Pip Value Calculator
Calculate the value of a pip for any currency pair and lot size.
Position Size Calculator
Determine the right position size based on your risk tolerance.
Risk Reward Ratio Calculator
Compare potential risk against reward before entering a trade.
Drawdown Recovery Calculator
Calculate the gain needed to recover from a trading drawdown.
Trading Compound Interest Calculator
Project compounded returns on your trading account balance.
Common Drawdown Recovery Mistakes to Avoid
Even traders who understand the math above sometimes undermine their own recovery. These are the mistakes worth watching for:
- Trying to "win it all back" in one trade. Oversizing a single position to recover a large drawdown quickly tends to produce a larger drawdown, not a faster recovery.
- Ignoring the compounding math. Assuming a 30% loss just needs a 30% gain leads to underestimating how long real recovery actually takes.
- Changing strategy mid-drawdown. Abandoning a previously tested approach out of panic, rather than reviewing it calmly afterward, often replaces one problem with a new, untested one.
- Refusing to reduce position size after a loss. Trading the same size after a large drawdown as before it means the smaller remaining account is now carrying proportionally more risk than it was designed for.
- Not tracking the numbers at all, which makes it easy to underestimate how deep a drawdown has actually gotten before it's addressed.
Investment risk disclaimer: This article is for general educational purposes only and isn't personalized investment, trading, or financial advice. Drawdown percentages, recovery math, and historical examples are illustrative and don't guarantee future results. Trading and investing involve real risk of loss, including loss of your full principal. Always consider your own risk tolerance and, if needed, speak with a licensed financial advisor before making trading or investment decisions.
Sources & References
This guide draws on guidance and research from the following organizations:
- Financial Industry Regulatory Authority (FINRA) — Regulatory Notice 26-10 on the new intraday margin requirements
- Financial Industry Regulatory Authority (FINRA) — Understanding the New Intraday Margin Requirements
- Morgan Stanley Investment Management, Counterpoint Global — Drawdowns and Recoveries: Base Rates for Bottoms and Bounces
More From Our Trading Guide
Still building your risk management toolkit? These related guides dig deeper into the topics covered above.
Frequently Asked Questions
What is a drawdown in investing or trading?
A drawdown is the percentage decline in the value of an investment, trading account, or portfolio from its most recent peak to its lowest point afterward, before it recovers. It's measured from high to low, not from your original starting balance. For example, if an account grows to $20,000 and then falls to $14,000 before turning around, that's a 30% drawdown, regardless of how much was originally deposited. Drawdowns are a normal part of trading and investing; what matters most is how large they get and how you manage them.
Why is a 50% drawdown so much harder to recover from than a 10% one?
Because percentage losses and percentage gains aren't calculated on the same base. A 10% loss only needs an 11.1% gain to break even, since you're still working with 90% of your capital. A 50% loss cuts your capital in half, so you need a 100% gain just to get back to where you started. The bigger the loss, the smaller your remaining base becomes, and the harder that remaining money has to work to climb back to even.
How much drawdown is too much?
There's no single number that applies to everyone, since it depends on your strategy, timeframe, and risk tolerance. Many professional traders and prop firms treat a maximum drawdown somewhere between 10% and 20% as a serious warning sign worth stepping back from, while drawdowns beyond 20-25% start requiring very large gains just to break even. A good personal rule is to set a maximum drawdown limit in advance, based on the math in this guide, rather than deciding in the moment while emotions are running high.
What is the 3-5-7 rule in trading?
The 3-5-7 rule is an informal risk management guideline used by many retail traders, not an official regulation. It generally suggests risking no more than 3% of your account on any single trade, keeping your total exposure across all open positions under 5%, and aiming for winning trades to outperform losing trades by a ratio of at least 7%. Different traders describe the exact numbers slightly differently, but the underlying idea is the same: cap your risk before you ever place a trade.
Does daily drawdown reset?
It depends on how it's defined. Many proprietary trading firms use a "daily drawdown" limit that resets at the start of each trading day, calculated from that day's opening balance or equity, so a bad day doesn't shrink the next day's allowed risk. A "maximum drawdown" limit, by contrast, usually does not reset daily, since it tracks the account's peak value over its entire history. Always check the specific rules of your broker, prop firm, or trading plan, since definitions vary.
Is trading gambling?
Not necessarily, but it can function like gambling if it's done without a plan. Gambling typically involves games with a fixed, negative expected value, where the odds are stacked against you by design. Trading, approached with a tested strategy, sound risk management, and realistic expectations, is closer to running a business with variable outcomes. That said, impulsive trading driven by excitement or chasing losses shares a lot of the same psychological patterns as problem gambling, which is part of why discipline matters so much.
Why do so many day traders lose money?
Multiple independent studies, including research from financial regulators and academic reviews of retail trading accounts, consistently find that a large majority of day traders lose money over time, with commonly cited failure rates ranging from roughly 70% to 97% depending on the market and timeframe studied. Only a small minority, often estimated at 1% to 4%, manage to be consistently profitable over multiple years. Trading costs, insufficient capital, poor risk management, and emotional decision-making are among the most frequently cited reasons.
Can you make a living from day trading?
A small number of people do, but it's far from typical. Research on retail trading accounts suggests only a small percentage of day traders earn enough to replace a full-time income consistently, and even fewer sustain it for many years. Daily and monthly income from day trading tends to be highly inconsistent rather than a steady paycheck. Most financial educators recommend treating day trading as a high-risk skill to develop gradually, with money you can afford to lose, rather than a reliable primary income source from day one.
Do you need $25,000 to be a day trader?
Not anymore, at least in U.S. margin accounts. From 2001 until June 2026, FINRA's Pattern Day Trader rule required a $25,000 minimum equity balance for anyone who made four or more day trades within five business days in a margin account. FINRA eliminated that $25,000 requirement and the "pattern day trader" label entirely, effective June 4, 2026, replacing it with a new intraday margin system that monitors real-time account risk instead. Brokers may still set their own minimums, so it's worth checking directly with yours.
Can a day trader hold a stock overnight?
Yes. Nothing prevents a trader from holding a position overnight; doing so simply means that particular trade isn't counted as a "day trade," since it wasn't opened and closed on the same day. Many traders intentionally hold select positions overnight or longer as part of a swing trading approach. The tradeoff is that overnight positions are exposed to news, earnings reports, or market moves that happen while the market is closed, which can create price gaps in either direction.
What is a maximum drawdown strategy?
A maximum drawdown strategy is any approach built around a predefined limit for how much an account is allowed to lose from its peak before trading stops, position sizes shrink, or the strategy is paused for review. Instead of reacting emotionally to losses as they happen, a trader or fund manager decides the limit in advance, often based on the recovery math covered earlier in this guide, and treats hitting that limit as a hard signal to pause rather than a suggestion.
Can you backtest drawdown?
Yes. Maximum drawdown is one of the standard metrics calculated when backtesting a trading strategy against historical price data, alongside measures like total return and win rate. A backtest can show you the largest peak-to-trough decline the strategy would have experienced historically, which is useful for setting realistic expectations. Keep in mind that backtested drawdowns represent the past, not a guarantee of future performance, since real-time trading involves costs, slippage, and conditions a backtest can't always fully capture.
What did Warren Buffett say about day trading?
Warren Buffett has spoken publicly for decades about preferring to hold shares of well-run businesses for the long term rather than trade frequently. He has pointed out that trading costs, fees, and taxes quietly reduce returns for active traders over time, and he's a well-known advocate of low-cost, diversified index fund investing for most people. Buffett's general view is that patience tends to be rewarded in markets more reliably than frequent buying and selling.
Is day trading addictive?
It can be, for some people. Day trading shares several features with activities psychologists associate with behavioral addiction, including frequent, fast feedback, variable rewards, and the ability to keep going at almost any hour. Some traders describe chasing losses or continuing to trade past their own risk limits in ways that resemble compulsive gambling. If trading starts to feel compulsive, is affecting your finances or relationships, or you find it hard to stop, it's worth talking with a mental health professional or a service that specializes in gambling or behavioral addiction.
About 100 Calculator
100 Calculator is a free hub of online calculators and educational guides covering finance, trading, crypto, health, education, and more. Every tool is built to be fast, accurate, and genuinely free, with no account or signup required.
We built this guide, and tools like the Drawdown Recovery Calculator referenced throughout it, to make everyday trading and investing questions a little easier to work through. Head back to the 100 Calculator homepage to explore the full library of tools, or learn more about the team behind them on our About Us page.