How Much Return You Need to Recover from a Drawdown
A straightforward look at the math behind drawdown recovery: why a 50% loss needs a 100% gain, how to calculate the return you need after any loss, and how traders keep drawdowns from spiraling out of control.
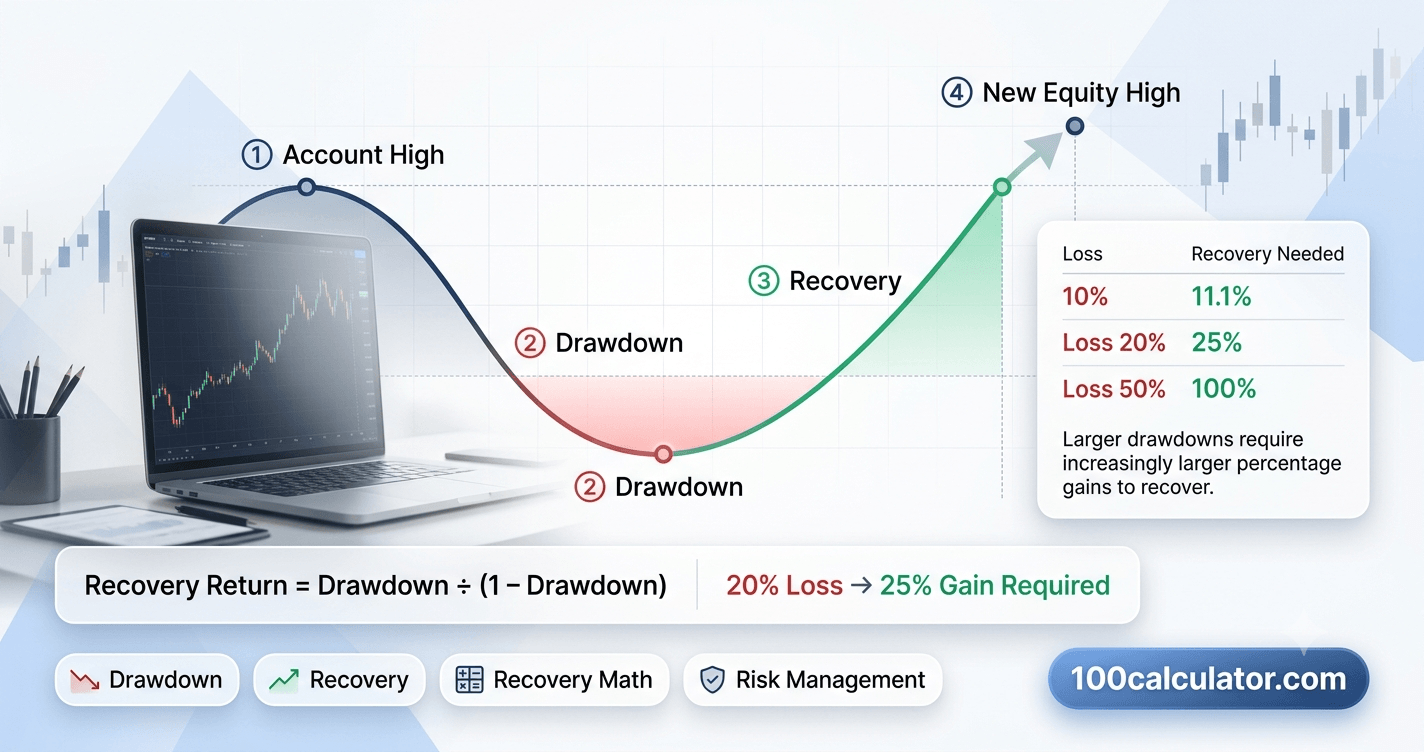
Lose 20% on a trade or an investment, and you need a 25% gain just to get back to even. Lose 50%, and the math turns unforgiving: you need a full 100% gain, not to profit, just to break even. That gap between what you lost and what it takes to earn it back is the entire problem with a drawdown, and it's why a loss that looks moderate on paper can quietly wreck an account.
A drawdown is the percentage drop from an account's highest value (its peak) to its lowest point after that (its trough), and recovering from one always takes a bigger percentage gain than the original loss, because that gain has to come from a smaller starting balance. A 10% loss only needs an 11% gain to recover. A 90% loss needs a 900% gain. The deeper the hole, the steeper the climb out. And the climb gets steeper faster than most people expect.
This guide walks through the exact formula behind drawdown recovery, a full percentage table you can check any loss against, and the risk management habits that keep traders and investors from digging a hole they can't climb out of. If you'd rather skip the manual math entirely, 100 Calculator's Drawdown Recovery Calculator does it for you the moment you enter your loss.
What Is a Drawdown?
In trading and investing, a drawdown measures how far your account has fallen from its most recent high point. It's expressed as a percentage, not a dollar figure, which is exactly why it's useful for comparing risk across accounts of totally different sizes. A $5,000 account and a $500,000 account can both experience a 30% drawdown, even though the dollar amounts involved look nothing alike.
The term shows up constantly in trading performance reports and fund disclosures, and it's actually part of formal U.S. regulatory filings, too. (NFA) Commodity trading advisors registered with U.S. regulators are required to disclose their historical "peak-to-valley" drawdowns to clients, which says something about how seriously the industry treats this number. It's not just a trading-forum buzzword.
Peak-to-Valley: How a Drawdown Is Actually Measured
The formal name for this measurement is a "peak-to-valley drawdown," and it works in three steps:
- Find the peak. This is the highest account value reached before the decline started, not your original deposit.
- Find the trough. This is the lowest point the account reaches after that peak, before it starts climbing again.
- Calculate the percentage drop between those two points. That number is your drawdown.
Notice that none of this involves your original starting balance. If you deposited $10,000, grew the account to $18,000, and then it fell to $13,500, your drawdown is measured from the $18,000 peak, not the $10,000 you started with. That drop from $18,000 to $13,500 is a 25% drawdown, even though you're still $3,500 ahead of where you began.
What "Maximum Drawdown" Means
Maximum drawdown is simply the single largest peak-to-valley decline an account or investment has experienced over a given period. It's one of the most widely used risk metrics in trading and portfolio management, because it answers a very practical question: in the worst stretch you've lived through, how much did you actually lose before things turned around?
Why a 50% Loss Needs a 100% Gain to Break Even
Here's the part that trips people up: percentage losses and percentage gains aren't symmetrical. A 10% loss and a 10% gain don't cancel each other out, and the gap between them widens fast as the loss gets bigger.
Say you start with $10,000. A 10% loss takes you to $9,000. To get back to $10,000, you now need a gain of $1,000 on a $9,000 base, which works out to 11.1%, not 10%. It's a small gap at this size, easy to miss.
Now push it further. A 50% loss takes that same $10,000 down to $5,000. Getting back to $10,000 from $5,000 means doubling your money — a 100% gain. Push it to 80%, and $10,000 becomes $2,000. Climbing back to $10,000 from $2,000 requires a 400% gain. The loss only grew 8 times larger (from 10% to 80%), but the required recovery gain grew roughly 36 times larger (from 11.1% to 400%).
The reason is simple once you see it: your loss is calculated against your original, larger balance, but your recovery gain has to be calculated against your new, smaller balance. Every dollar you lose shrinks the base your future gains have to work from.
Drawdown Recovery Formula
Recovery % = Loss % ÷ (100% − Loss %) × 100
Loss % — how much your account fell from its peak, as a percentage
Recovery % — the gain you need on your new, smaller balance to get back to that peak
Working Through the Formula With Real Numbers
Let's run a 30% loss through the formula. Take the loss (30), divide it by what's left after the loss (100 − 30 = 70), then multiply by 100: 30 ÷ 70 × 100 = 42.9%. A $20,000 account that drops 30% to $14,000 needs to gain 42.9% on that $14,000 to get back to $20,000. Check the math: 42.9% of $14,000 is about $6,000, and $14,000 + $6,000 = $20,000. It works out exactly.
Drawdown Recovery Percentage Table
Rather than running the formula by hand every time, here's a reference table covering common drawdown sizes. Find your loss percentage on the left, and read the required recovery gain on the right.
| Loss From Peak | Gain Needed to Break Even |
|---|---|
| 5% | 5.3% |
| 10% | 11.1% |
| 15% | 17.6% |
| 20% | 25.0% |
| 25% | 33.3% |
| 30% | 42.9% |
| 40% | 66.7% |
| 50% | 100.0% |
| 60% | 150.0% |
| 70% | 233.3% |
| 80% | 400.0% |
| 90% | 900.0% |
Look at the jump between 50% and 90%. The loss only grows by 40 percentage points, but the required gain grows by 800 percentage points. That's the asymmetry in action, and it's the single biggest reason experienced traders treat capital preservation as more important than chasing big wins. Once a loss gets deep enough, no realistic string of gains fixes it quickly.
How to Use a Drawdown Recovery Calculator
Running the formula by hand works fine for round numbers, but real losses rarely land on a clean 10% or 25%. A drawdown recovery calculator handles the odd percentages instantly and removes any chance of a rounding mistake, which matters more than it sounds like when you're deciding whether a strategy is actually working.
What to Enter
Most drawdown recovery calculators, including 100 Calculator's version, only ask for two things: your account's peak value and its current, or trough, value. Some let you enter a loss percentage directly instead, if you already know it. Either way, you don't need your original deposit amount, only the peak and the point you're recovering from.
Reading Your Result
The output is the exact percentage gain you need, calculated on your current balance, to get back to your prior peak. Some calculators also show the dollar amount, and a few will estimate a rough timeline if you enter an expected average return. Treat that timeline as a ballpark, not a promise — markets and trading results don't move in a straight line.
Free Online Tool
Skip the manual math
100 Calculator's Drawdown Recovery Calculator works out the exact return you need the moment you enter your peak and current balance, with no signup required.
What Counts as a Good Maximum Drawdown?
There's no single official cutoff for a "good" maximum drawdown, and it's worth being skeptical of anyone who gives you one number as though it applies to every account. What counts as acceptable depends heavily on your time horizon, your goals, and how much volatility you can sit through without abandoning your plan.
For context: even the S&P 500, a widely diversified index, has been through some brutal drawdowns. The index fell roughly 49% during the dot-com crash of 2000–2002, about 57% during the 2008 financial crisis measured peak to trough, and around 34% during the COVID-19 crash in early 2020. If a diversified index of hundreds of large companies can lose more than half its value, a single stock, a leveraged trading account, or a concentrated crypto position can obviously go much deeper.
Typical Drawdown Ranges by Investor and Trader Type
With that context in mind, here's how many investors and traders think about drawdown tolerance in practice. These are common rules of thumb, not regulatory thresholds:
| Profile | Drawdown Often Considered Reasonable | Typical Example |
|---|---|---|
| Conservative / capital preservation | 5%–10% | Cash-heavy or short-term bond holdings |
| Balanced / moderate | 10%–20% | A mixed stock-and-bond portfolio |
| Growth-focused / mostly equities | 20%–35% | A diversified stock index portfolio |
| Active or leveraged trading | 10%–25% (self-imposed limit) | Day trading, forex, or futures accounts |
Notice that the last row isn't a natural market outcome. It's a rule traders set for themselves on purpose. (FINRA) Risk tolerance is personal, and the accounts that survive long enough to compound their gains are usually the ones with a hard limit on how deep a drawdown is allowed to get before action is taken.
How Long Does It Take to Recover From a Drawdown?
This is the question the recovery percentage alone can't answer, because time depends on your average rate of return, not just the size of the hole. A 20% drawdown needing a 25% gain might recover in a few months during a strong market or drag on for years in a flat one. There's no fixed timeline attached to the percentage itself.
A rough way to estimate it: divide the recovery percentage you need by your expected average annual return. A 25% recovery target at an 8% average annual return suggests roughly three years, all else being equal. Push the drawdown to 50%, needing a 100% gain, and that same 8% average return stretches the estimate to roughly nine years. This ignores compounding and assumes a steady, unrealistic return every single year, but it's useful for seeing the general shape of the problem.
What Slows Recovery Down
A few things consistently stretch recovery timelines beyond what the simple math suggests:
- Withdrawing money during the drawdown, which shrinks the base your recovery gains have to work from
- Fees and trading costs that quietly eat into gains on the way back up
- Switching strategies mid-drawdown out of frustration, often right before the original approach would have recovered
- Taxes owed on any gains realized along the way, in taxable accounts
Historically, major stock market drawdowns have often taken noticeably longer to recover than they took to happen. The 2008 decline played out over roughly a year, but the S&P 500 didn't reclaim its prior peak until several years afterward. Drops tend to be fast; climbs tend to be slow.
Can Compounding Help You Recover Faster?
Yes, with one important caveat: compounding doesn't change the recovery percentage you need, only how quickly you can reach it. A 50% loss still needs a 100% gain no matter what you do afterward. What compounding changes is the path.
If you reinvest every gain instead of withdrawing it, each percentage gain applies to a growing balance instead of a fixed one, which speeds up growth the longer you stay invested. Our guide to how compound interest grows your money over time covers the mechanics in more depth, but the short version for drawdown recovery is this: consistent reinvestment tends to outrun simple, non-compounded growth by a wider margin the longer the recovery takes.
For active traders, this shows up as reinvesting profits back into position size as the account grows, rather than pulling gains out along the way. For long-term investors, it's often as simple as automatically reinvesting dividends instead of taking them as cash. Either way, the principle is the same: a smaller number of consistent gains, compounded over time, usually beats waiting on one big trade to erase the whole loss at once. Our Trading Compound Interest Calculator can help you model how reinvested gains might add up over your own recovery timeline.
Drawdown vs. Loss: What's the Real Difference?
These two words get used interchangeably in everyday conversation, but they measure different things. A loss is usually measured against your original investment or deposit. A drawdown is measured against your account's highest point, whenever that peak happened to occur.
Here's where it gets counterintuitive: you can be in a drawdown while still showing an overall profit. Say you deposit $10,000, grow the account to $16,000, and then it slips to $13,000. Compared to your original $10,000, you're still up $3,000 overall — a genuine gain. But compared to your $16,000 peak, you've given back $3,000, which is an 18.75% drawdown. Both numbers are true at the same time; they're just answering different questions.
This distinction matters most for anyone tracking risk, not just returns. A strategy can be profitable overall and still carry dangerous drawdowns along the way, and a strategy that never lost money relative to the original deposit can still have put an account through a rough, high-drawdown ride to get there.
How Professional Traders and Investors Manage Drawdown Risk
Given how punishing the recovery math gets, the traders and portfolio managers who last a long time in markets spend more energy avoiding deep drawdowns than chasing large gains. A handful of habits show up again and again.
Position Sizing
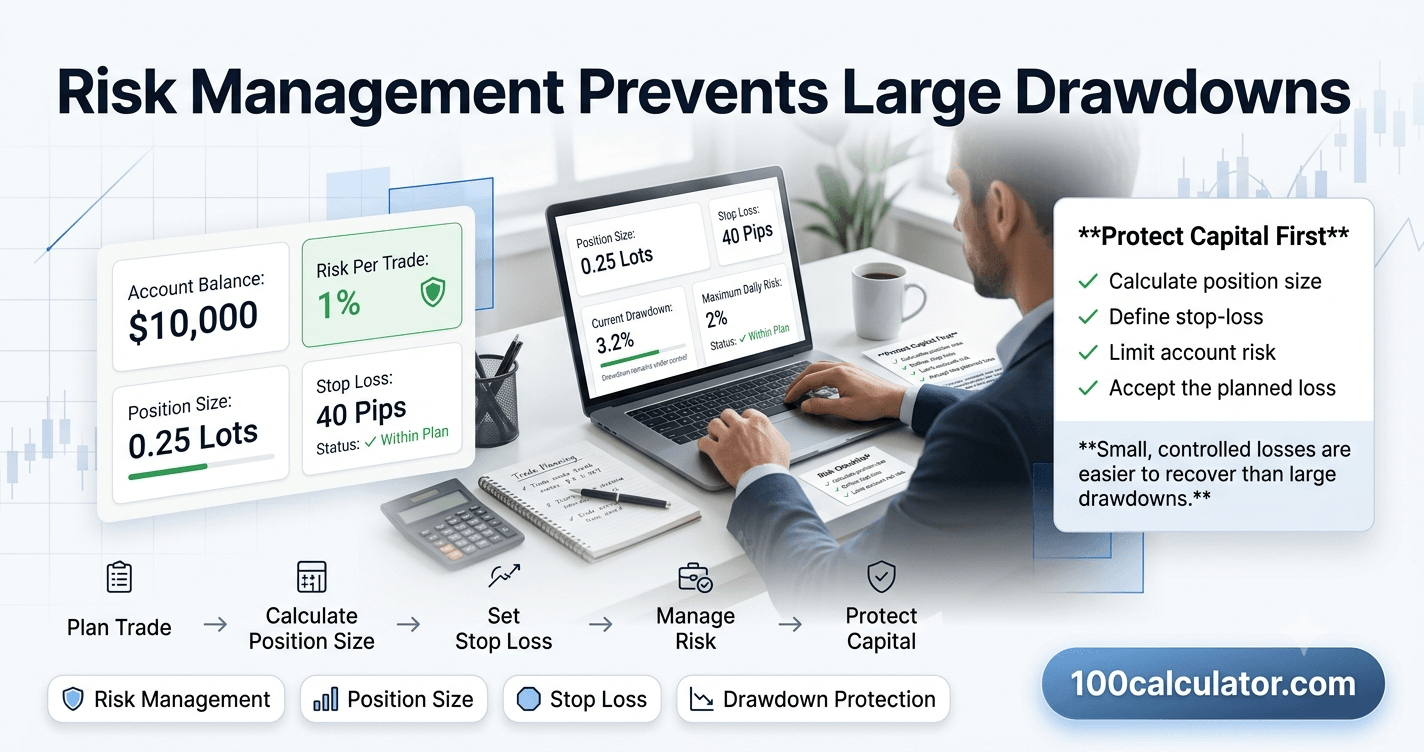
Position sizing means deciding how much of your account to risk on any single trade before you place it, rather than after. A trader risking 1–2% of their account per trade can be wrong many times in a row and still have most of their capital left. A trader risking 20% per trade only needs a handful of bad trades to reach the kind of drawdown that's genuinely hard to recover from. 100 Calculator's Position Size Calculator can help you work out an appropriate trade size before you enter a position, not after a loss forces the question.
Stop-Loss Discipline
A stop-loss order automatically closes a position once it hits a predetermined loss level, taking the decision out of your hands in the moment. This matters because the moment a trade is going badly is exactly when emotions are loudest and judgment is weakest. Traders who consistently honor their stop-loss levels tend to experience smaller, more predictable drawdowns than those who give a losing trade "a bit more room" every time it moves against them. Checking your risk-reward ratio before entering a trade helps set a stop-loss level that actually makes sense for the setup, instead of picking one arbitrarily.
Diversification
Spreading capital across assets, strategies, or markets that don't all move together reduces the odds that a single event wipes out a large share of an account at once. (SEC) The core idea is old and simple: don't put everything into one trade, one stock, or one strategy, because you can't know in advance which one will have its worst month at the same time as your other positions. Leveraged accounts, including many forex and crypto futures positions, deserve extra caution here, since margin can turn an otherwise survivable price move into a drawdown that wipes out an account entirely. Traders using leverage often check a liquidation price calculator before opening a position, specifically to see how much room they have before a drawdown becomes forced, involuntary, and final.
Related Calculators
Put what you just read into practice, try these free tools instantly, no sign-up required.
Pip Value Calculator
Calculate the value of a pip for any currency pair and lot size.
Position Size Calculator
Determine the right position size based on your risk tolerance.
Risk Reward Ratio Calculator
Compare potential risk against reward before entering a trade.
Drawdown Recovery Calculator
Calculate the gain needed to recover from a trading drawdown.
Trading Compound Interest Calculator
Project compounded returns on your trading account balance.
Common Mistakes That Turn a Drawdown Into a Disaster
A drawdown by itself isn't a crisis. Every trader and long-term investor experiences them. What actually causes lasting damage is usually a handful of predictable reactions to a drawdown, not the drawdown itself.
- Doubling down to "win it back" fast. Increasing position size after a loss, specifically to recover it quickly, multiplies the risk at exactly the moment your account can least afford it.
- Abandoning a working strategy at the worst possible time. Every strategy has losing stretches. Switching strategies mid-drawdown often means giving up right before the original approach was due to recover.
- Ignoring position sizing after a string of wins. Confidence from a winning streak tends to creep position sizes up right before the losing streak that starts the next drawdown.
- Checking the account obsessively during a drawdown. Frequent checking tends to increase emotional, reactive decisions rather than deliberate ones.
- Treating a drawdown as a reason to stop tracking numbers. This is exactly when the data matters most, not least.
None of these mistakes are really about the market. They're about behavior under pressure. The recovery formula is fixed and impossible to negotiate with, but how you respond to a drawdown while it's happening is entirely within your control.
Building a Recovery Plan After a Drawdown
Once a drawdown has already happened, the goal shifts from prevention to management. A short, honest plan tends to work better than an emotional reaction.
- Calculate the exact recovery percentage you need, using the formula or calculator above, so you're working from a real number instead of a vague sense of "a lot."
- Review what actually caused the drawdown before changing anything. A market-wide decline calls for a different response than a mistake specific to your own strategy.
- Reduce position size temporarily while confidence and account balance both rebuild, rather than trading at full size again immediately.
- Set a maximum drawdown limit going forward, and decide in advance what happens if you hit it again, before you're in the moment and under pressure.
- Track your recovery against realistic timelines, not against how fast you'd like it to happen.
Should You Keep Investing During a Drawdown?
For long-term investors, this often depends on strategy. Someone using dollar-cost averaging into a diversified portfolio may benefit from continuing to invest during a drawdown, since they're buying at reduced prices, which can lower their average cost basis over time. For active traders, the calculation is usually different: adding to a losing position without a clear plan tends to deepen a drawdown rather than shorten it.
There's no universal answer here, and it's worth being wary of anyone who insists there is. The right choice depends on whether your original reasons for the position or strategy still hold, your time horizon, and whether you're adding capital based on a plan or based on the discomfort of watching a balance fall.
Investment risk disclaimer: This article is for general educational purposes only and isn't a substitute for personalized financial or investment advice. Drawdown recovery math shows how percentages work, but it can't predict future returns, market conditions, or how any specific investment or trading strategy will perform. Trading and investing involve the risk of loss, including the possible loss of your entire principal. Always consider your own financial situation and risk tolerance, and talk to a licensed financial advisor before making investment or trading decisions.
More From Our Trading Guide
Want to dig deeper into managing trading risk? These related guides build on the concepts covered above.
Frequently Asked Questions
What is the formula for drawdown recovery?
The formula is: Recovery % = Loss % ÷ (100% − Loss %) × 100. Divide the percentage you lost by what's left after that loss, then multiply by 100. For example, a 25% loss leaves 75% of your capital, so you'd divide 25 by 75 and multiply by 100, which gives a required gain of about 33.3% to get back to your starting balance. The formula works the same way whether you're calculating recovery for a stock portfolio, a forex account, or a crypto position.
Why does a 50% loss require a 100% gain to break even?
Because the gain is calculated on a smaller number than the loss was. If you start with $10,000 and lose 50%, you're left with $5,000. To get back to $10,000 from $5,000, you need to double your money, which is a 100% gain. The percentages look mismatched, but the dollar amounts match exactly: you lost $5,000 and you need to gain $5,000 back. The deeper the loss, the smaller the remaining base, and the bigger the percentage gain needed to recover it.
How much return do I need to recover from a 30% drawdown?
A 30% drawdown needs a gain of about 42.9% to fully recover. Using the formula, 30 divided by 70 (the 70% of your capital that's left) equals 0.4286, or 42.86% once converted to a percentage. So if a $50,000 account drops to $35,000 after a 30% loss, it needs to grow back to $50,000, which is a 42.9% gain from its new $35,000 base.
What is considered a good maximum drawdown?
There's no single official number, but many investors treat drawdowns under 10–15% as manageable for conservative portfolios, 15–25% as reasonable for balanced portfolios, and up to 20–35% as within range for growth-focused, mostly-equity portfolios. Active traders using leverage often set their own hard limits, commonly somewhere between 10% and 25% of account value, specifically to avoid the steep recovery math that comes with larger losses. The right number depends on your goals, time horizon, and how much risk you can actually tolerate without abandoning your strategy.
How long does it typically take to recover from a drawdown?
It depends entirely on the size of the drawdown and the average return of whatever you're invested in. A shallow 10% drawdown might recover in a few months during a normal market. A deep 50% drawdown, which needs a 100% gain, can take several years even with solid average returns, since compounding needs time to work. Historically, major stock market drawdowns have often taken longer to recover from than they took to happen in the first place, sometimes several times longer.
What's the difference between a drawdown and a loss?
A loss is the money or percentage you're down compared to what you originally invested. A drawdown is specifically the decline from your account's most recent peak value, regardless of your original investment. If your account grows from $10,000 to $15,000 and then falls to $12,000, you still have an overall profit compared to your original $10,000, but you've experienced a drawdown of 20% from your $15,000 peak. Drawdown measures the ride, not just the destination.
Can compounding help me recover from investment losses faster?
Yes, reinvesting your gains instead of withdrawing them lets each percentage gain build on a larger base over time, which speeds up recovery compared to simple, non-compounded growth. It won't erase the basic math of drawdown recovery: a 50% loss still needs a 100% gain no matter how you invest. But consistent reinvestment, combined with steady average returns, tends to recover losses faster than pulling money out along the way or waiting on a single big recovery trade.
Should I keep investing during a drawdown?
For long-term investors using strategies like dollar-cost averaging, continuing to invest during a drawdown can actually lower your average cost basis, since you're buying at reduced prices. For active traders, the answer is usually different: adding to a losing position without a clear risk management plan tends to deepen the drawdown rather than fix it. The right choice depends on your strategy, time horizon, and whether your original reasons for investing still hold up.
How do professional traders limit their drawdowns?
Professional traders typically rely on a few core habits: sizing each position so no single trade can do serious account damage, using stop-loss orders to cap losses automatically, and diversifying across assets or strategies that don't all lose money at the same time. Many also set a maximum drawdown limit in advance, such as 15% or 20% of account value, and reduce their trading size or stop trading entirely if they hit it, rather than trying to trade their way back out.
What percentage gain is needed after a 50% loss?
A 50% loss needs exactly a 100% gain to break even. This is the clearest example of how the drawdown recovery formula works. Half your capital is gone, so you have to double what's left just to get back to where you started. This is one reason a 50% loss is considered far more dangerous than a 25% loss, even though it's only twice as large on paper. The recovery gain required is four times as large, not two.
Does the recovery formula work the same for stocks, forex, and crypto?
Yes, the underlying math is identical across every asset type, because it's based purely on percentages, not on what you're trading. A 40% drawdown in a stock portfolio, a forex account, or a crypto wallet all need the same 66.7% gain to recover. What changes between markets is how likely large drawdowns are and how quickly prices tend to move, not the recovery formula itself.
What's the best way to reduce the risk of large drawdowns?
Position sizing and diversification are usually the two most effective tools, since they limit how much any single trade or asset can hurt your overall account. Setting a personal maximum drawdown limit, using stop-loss orders, and avoiding excessive leverage also help keep losses from compounding into something much harder to recover from. None of these guarantee you'll avoid a drawdown entirely, but they keep the ones you do experience closer to the shallow end of the recovery table.
About 100 Calculator
100 Calculator is a free hub of online calculators and educational guides covering health, finance, trading, crypto, education, and more. Every tool is built to be fast, accurate, and genuinely free, with no account or signup required.
We built this guide, and tools like the Drawdown Recovery Calculator referenced throughout it, to make trading and investing math easier to work through before you act on it. Head back to the 100 Calculator homepage to explore the full library of tools, or learn more about the team behind them on our About Us page.