Step-by-step math and statistics explanations: how to
interpret a p-value, calculate a z-score, compare mean
absolute deviation with standard deviation, and work through
volume and convergence formulas.
Statistics and Geometry Formulas, Worked Step by Step
Statistics and calculus concepts tend to click once you see
them worked through with actual numbers, not just stated as a
formula. This category is built around that idea, covering
both statistics and geometry topics that show up constantly in
coursework.
On the statistics side, you'll find a full explanation of how
to interpret a p-value in hypothesis testing and what a
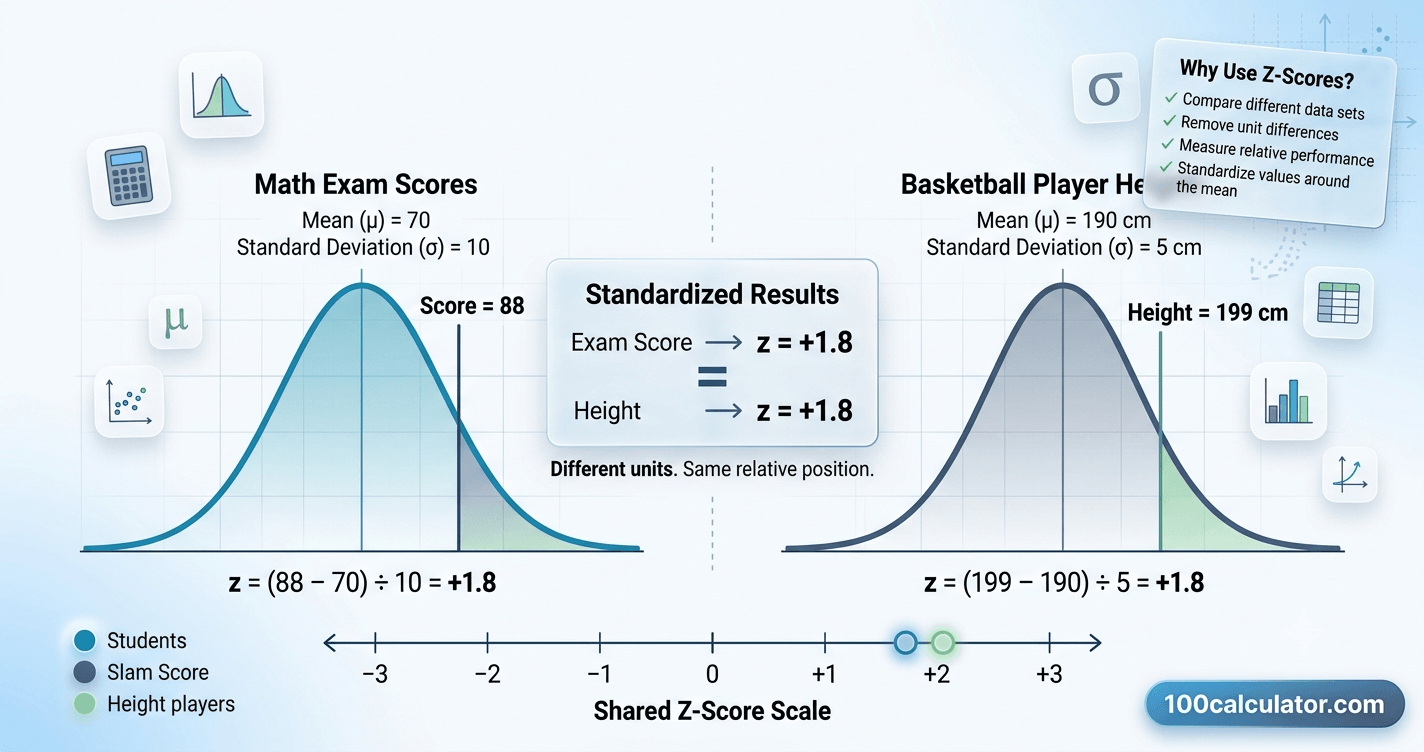
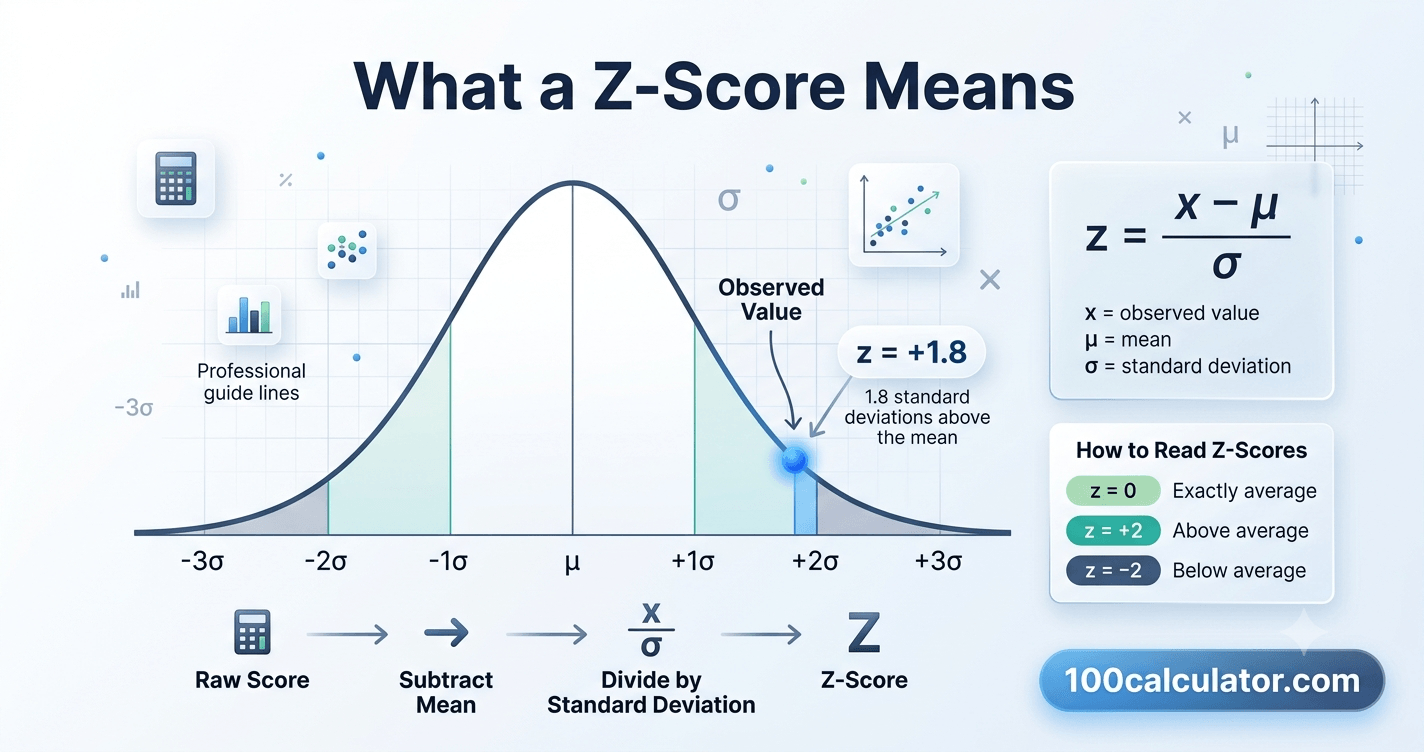
p-value really tells you about significance, plus a breakdown
of z-scores: how to calculate one correctly and how to use
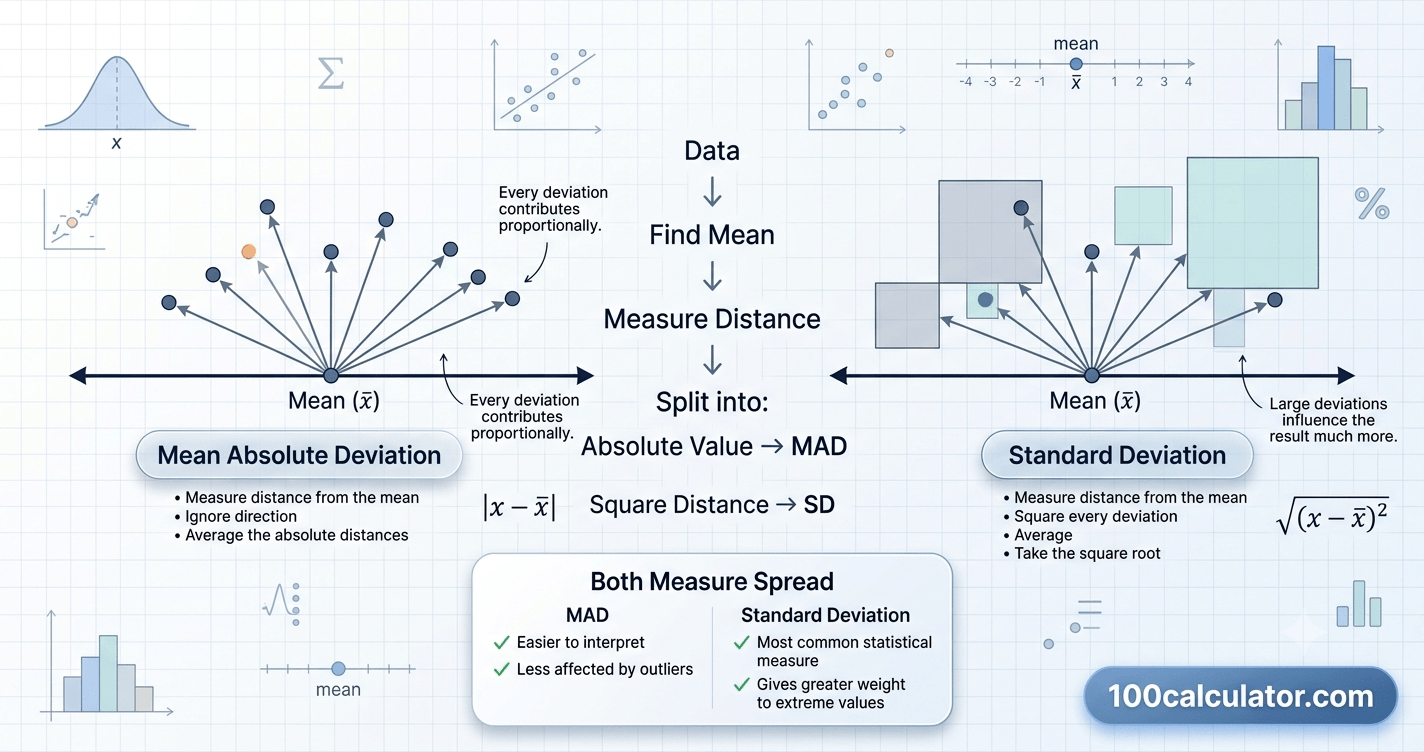
z-scores to compare values across two different data sets. We
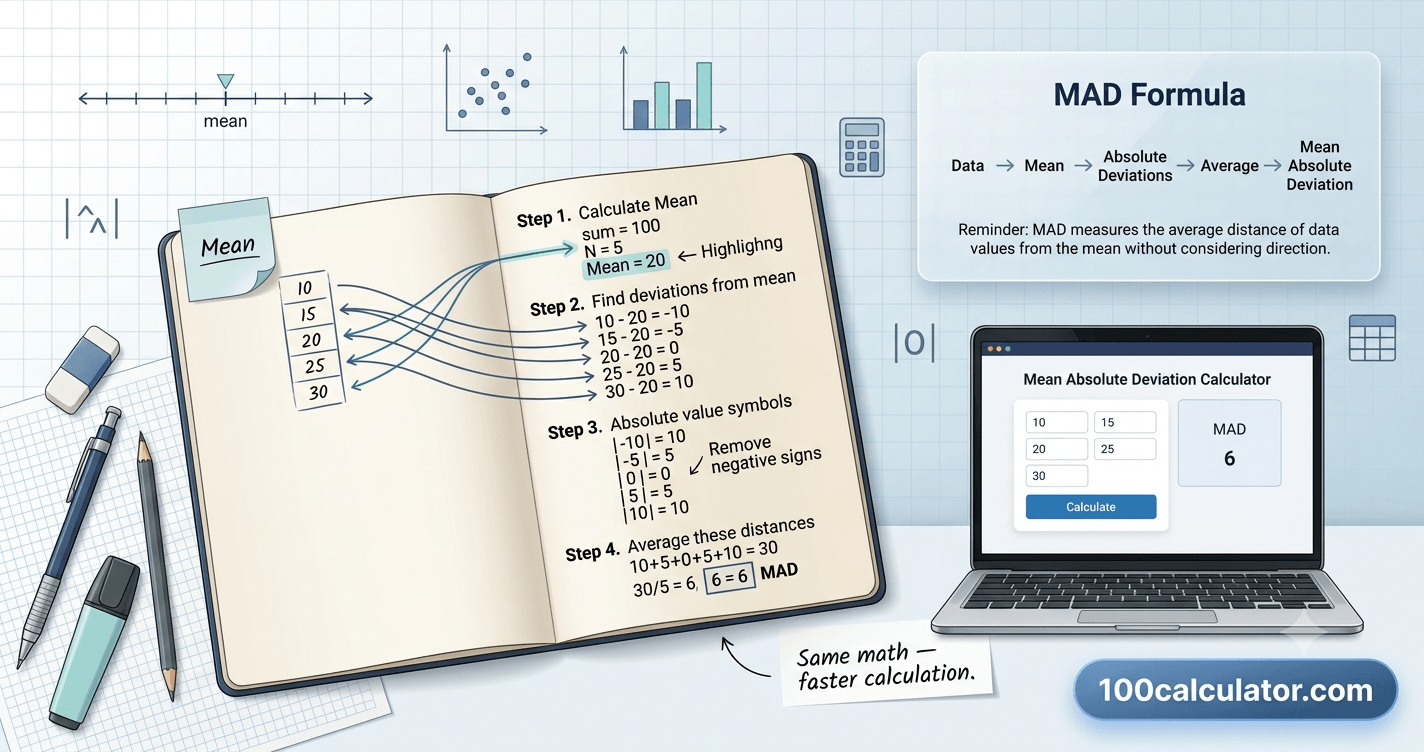
also compare mean absolute deviation with standard deviation
directly, including how to calculate mean absolute deviation
step by step, so the difference between the two measures of
spread actually makes sense.
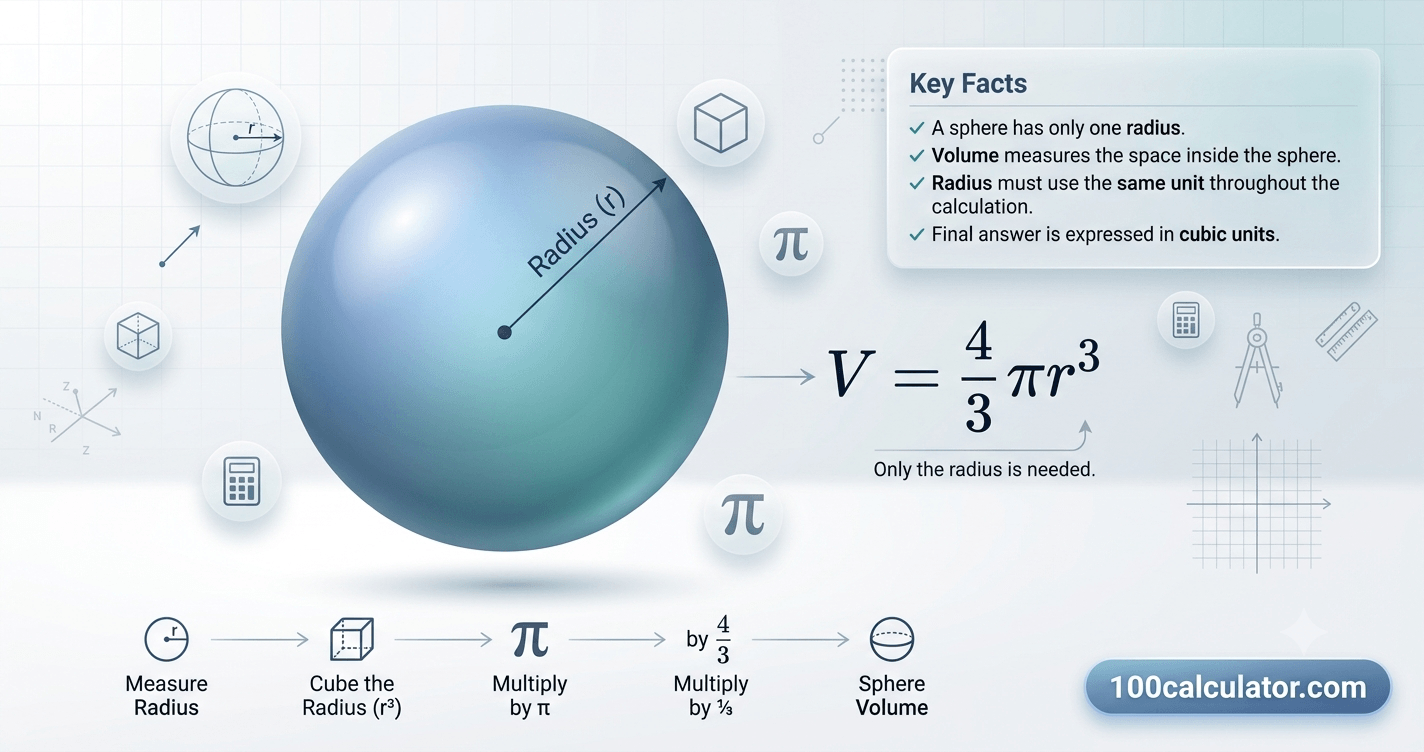
On the geometry and calculus side, there's a full walkthrough
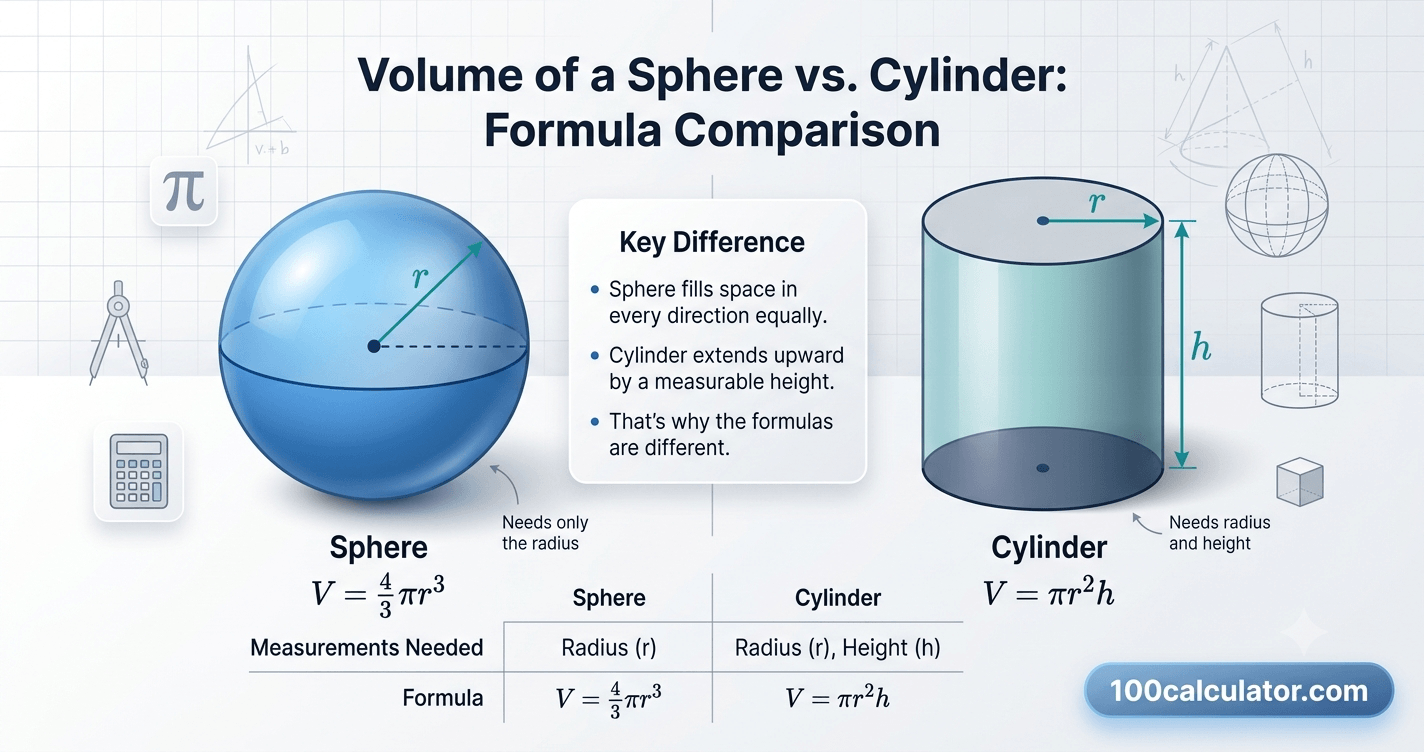
of how to calculate the volume of a sphere correctly, how that
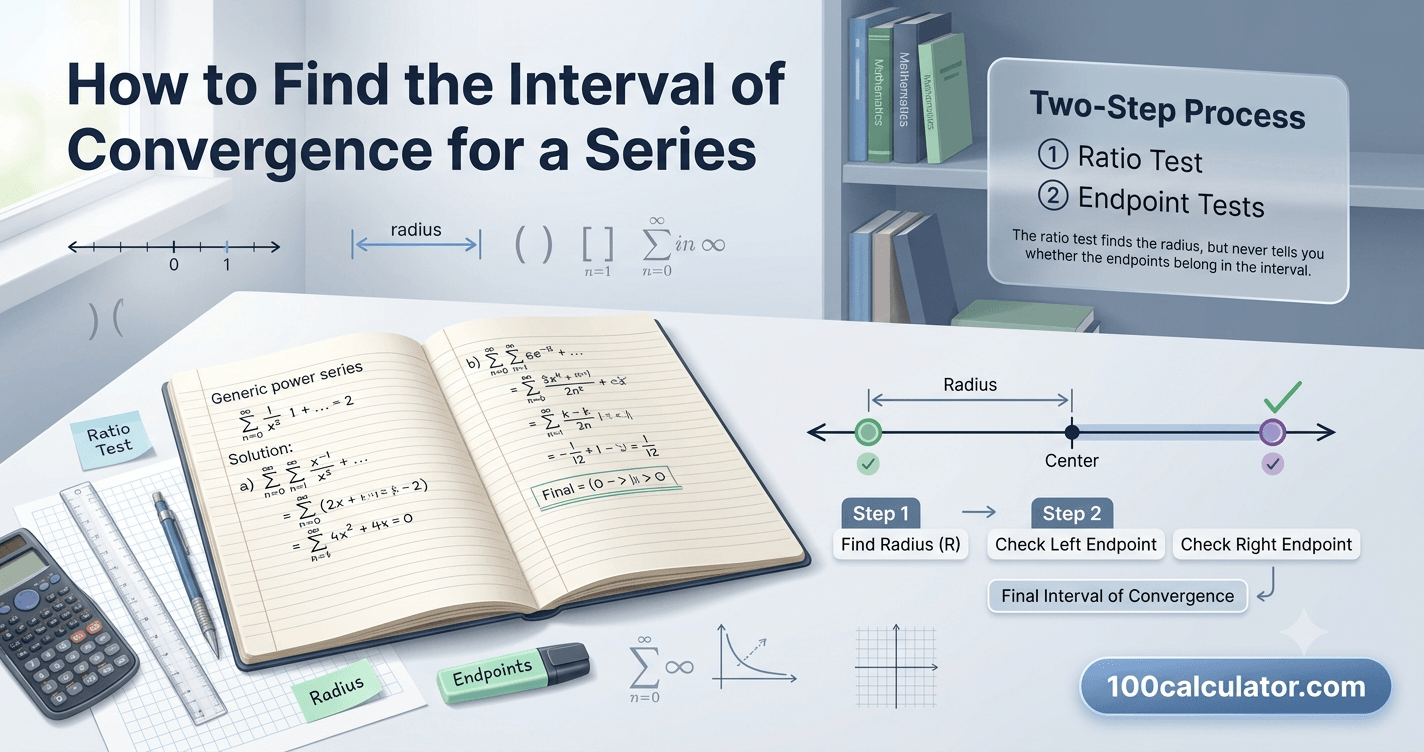
compares to a cylinder's volume, and how to find the interval
of convergence for a series, along with the distinction
between radius of convergence and interval of convergence,
which trips up a lot of students on first pass. Each guide
favors a worked example over an abstract proof.
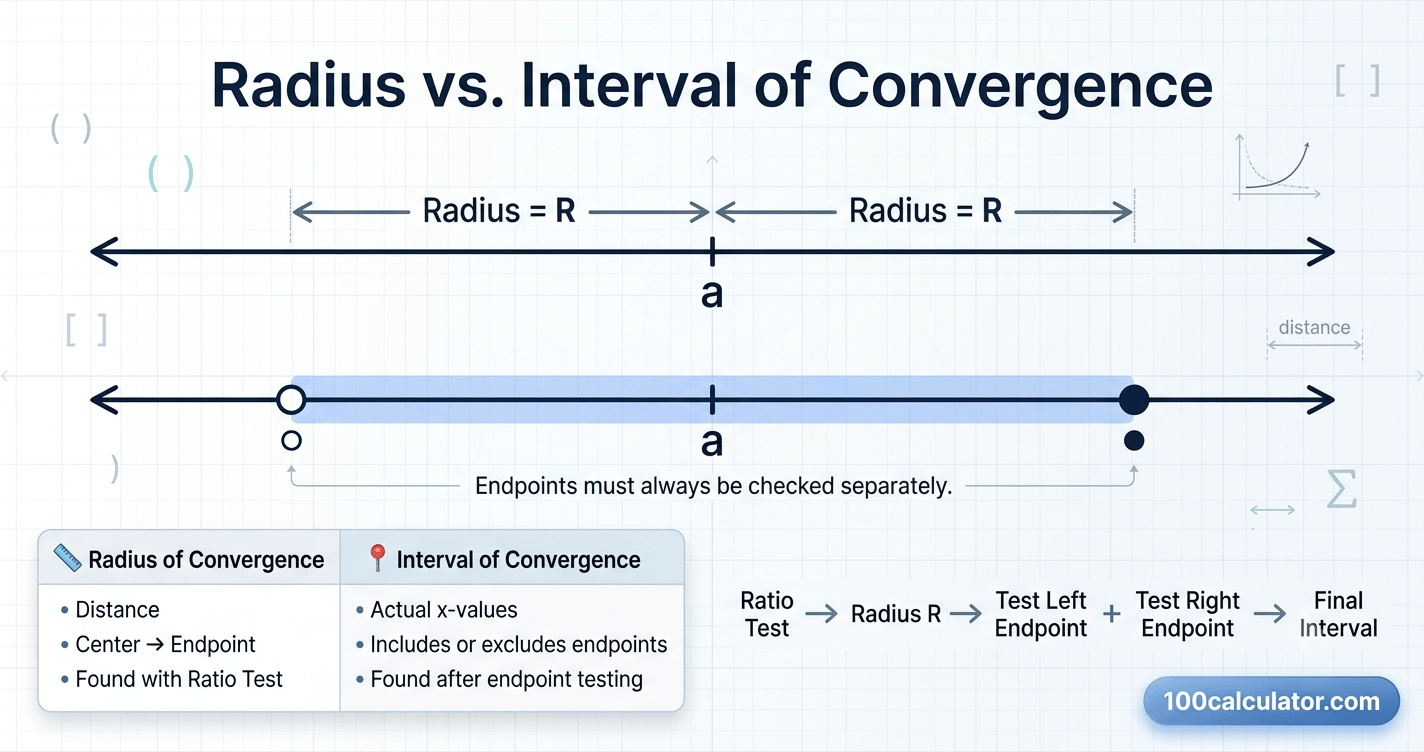
Radius of convergence is one number. Interval of
convergence is the full x-value range. See the
difference, plus a free interval of convergence
calculator.
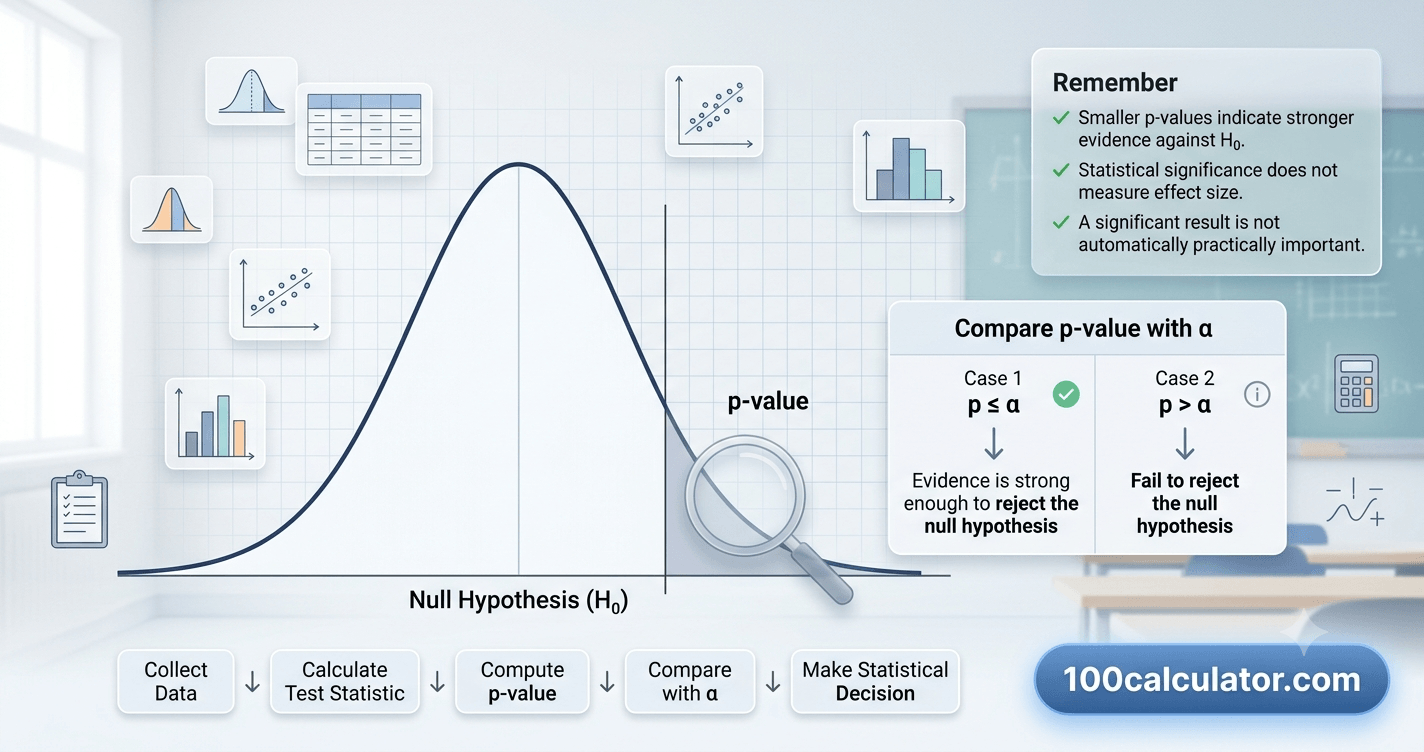
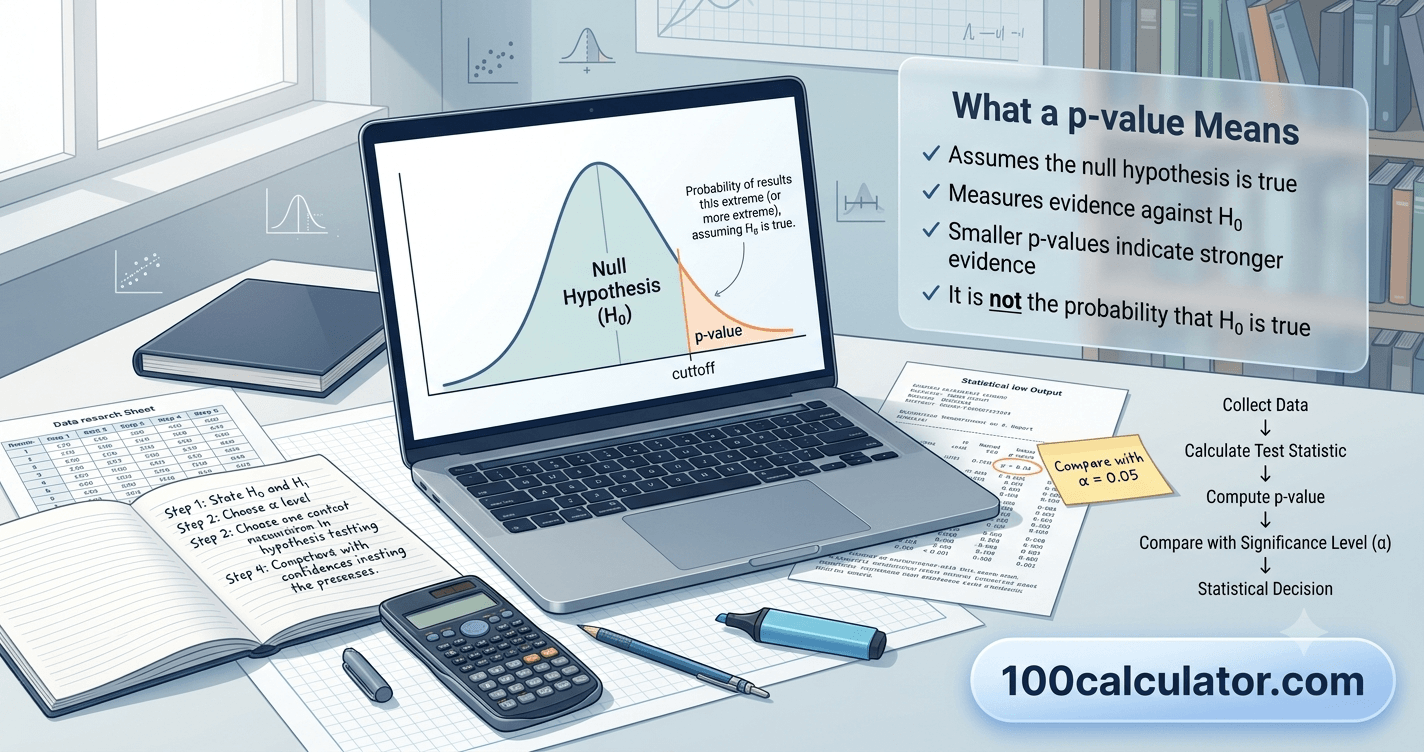
A p value shows how likely your results are due to
chance, not proof your hypothesis is true. Learn what it
really means and how to interpret it correctly.
 Math & Statistics